Fig. 3.
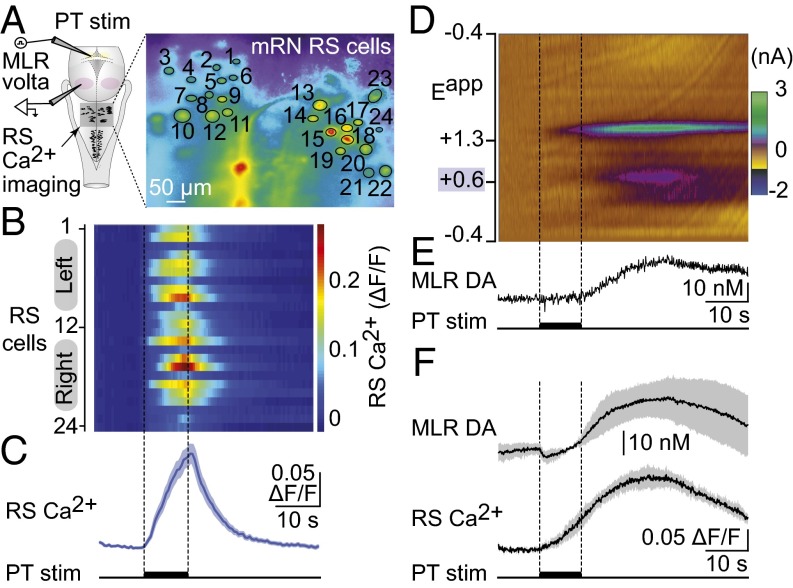
Stimulation of the PT evokes DA release in the MLR together with RS activity in salamanders. (A) Schematic dorsal view of the salamander brain. (Right) Ca2+ fluorescence at rest of RS cells (encircled in black) of the mRN labeled with Ca2+ Green dextran amines. (B) Color plots illustrating the Ca2+ responses (ΔF/F) of RS cells in response to PT stimulation (10-s train, 5 Hz, 2.5 μA, 2-ms pulses) (Fig. S2 J–K). Each line illustrates the response of individual cells that are numbered from top to bottom: cells 1–12 located on the left side of the brain and cells 13–24 on the right side. Warmer colors (red) indicate larger Ca2+ responses. (C) Average Ca2+ response for the 24 cells illustrated in A and B. (D) Local activation of cell bodies in the PT by microinjections (10-s train, 2 Hz, 50-ms pulses) of d-glutamate (5 mM, 2 Hz, 20 pulses of 50–200 ms, 5–20 psi, 0.05–3.57 nL per injection) evokes DA release in the MLR (Fig. S2 L and M). Single-trial color plot depicts current changes (color) as a function of electrode potential (y axis) across time (x axis). DA [identified by its oxidation (∼0.6 V; purple feature) (Fig. S3B)] was transiently evoked following PT activation. We detected an additional electroactive species (∼1.2 V, green feature) that we identified as hydrogen peroxide (Fig. S3 A and B). (E) Changes in DA concentration in the MLR extracted from the electrochemical data in D. (F) Average simultaneous change in MLR DA concentration and RS Ca2+ responses in the same trials (n = 19 stimulations from four preparations) in response to chemical stimulation of the PT with d-glutamate (5 mM, 2 Hz, 20 pulses of 100–200 ms, 10 psi, 0.83–1.85 nL per injection). Mean ± SEM are illustrated.

