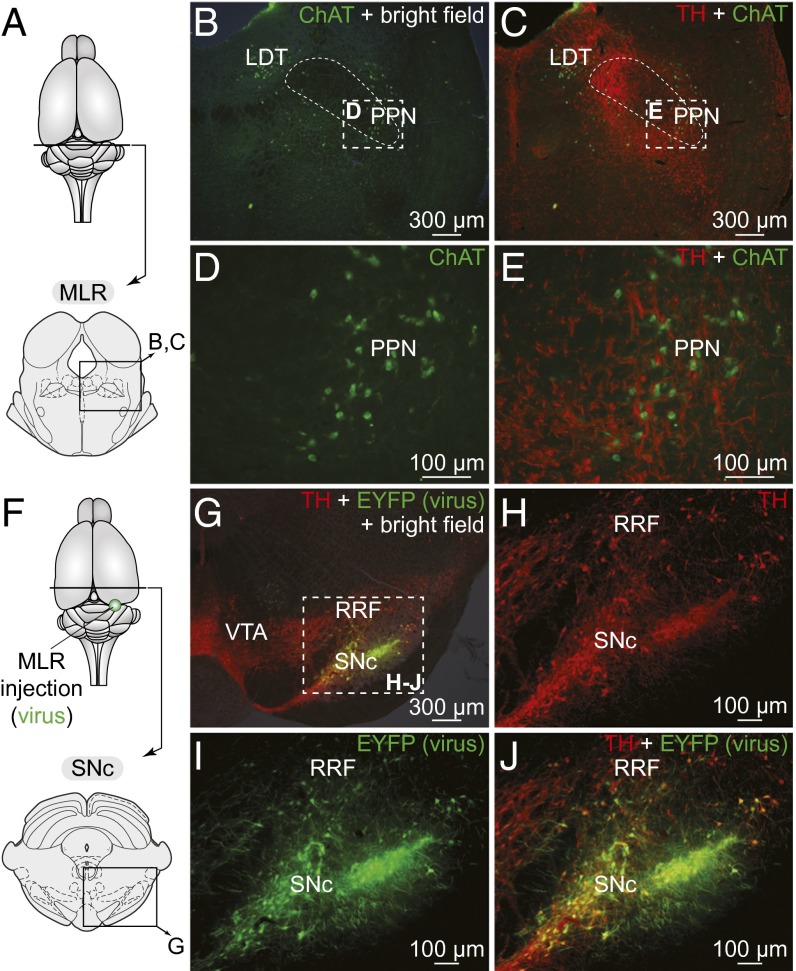
Fig. 4.
DA cells from the SNc project down to the MLR in rats. (A) Schematic dorsal view of the rat brain. At the bottom, the diagram illustrates a cross section at the level of the MLR with the approximate location of the photomicrographs shown in B and C. (B–E) Fibers and varicosities immunoreactive to TH (red) in proximity with cells positive for ChAT (green) in the PPN, a landmark of the MLR (2). (D and E) Magnifications of the dashed rectangles in B and C, respectively. In B and C the superior cerebellar peduncle is delineated with thin dashed lines. (F) Approximate location of the in vivo virus injection for virogenetic labeling experiments. At the bottom, the diagram illustrates a cross-section at the level of the SNc with the approximate location of the photomicrographs shown in G. (G–J) Cells retrogradely labeled in the SNc and to a lower extent in the RRF following injection in the PPN (Fig. S5 A and B) of a Cre-dependent virus encoding for the EYFP (green) in transgenic rats expressing Cre-recombinase in TH neurons. The cells labeled by this virus (green, I) were positive for TH (red, H and J) as previously reported (30). (H–J) Magnifications of the dashed rectangle in G. Data from A–E and F–J are from two different animals.

