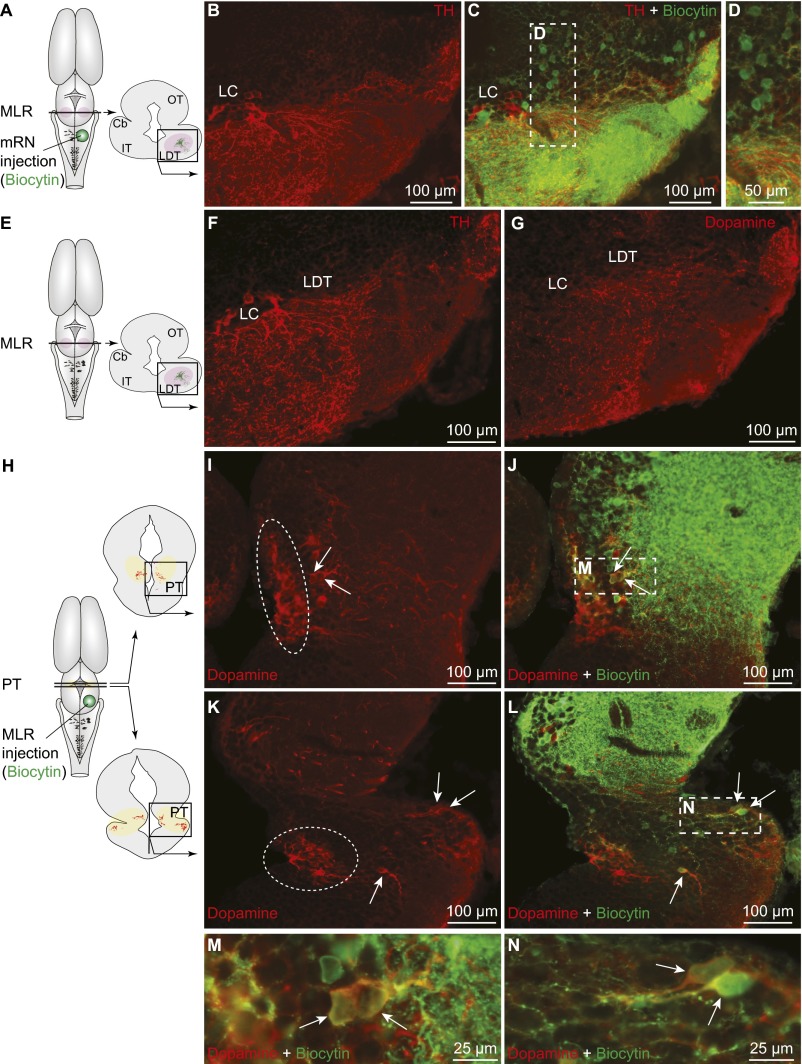
Fig. S1.
Comparison of the distributions of TH and DA immunofluorescence in the MLR and PT in salamanders. TH and DA data were obtained from different animals with different fixation methods. (A–C) TH+ (red) fibers and varicosities were in close proximity with MLR cells retrogradely labeled from an injection of biocytin (green) in the mRN (Fig. S2B). (D) A magnification of the dashed rectangle in C. (E–G) Photomicrographs showing the similarity in the number and distribution of fibers and varicosities positive for TH or DA in the laterodorsal tegmental nucleus (LDT). Note that the cells of the locus coeruleus (LC) were not positive for DA. (H–N) Unilateral injection of the tracer biocytin (green) in the MLR (Fig. S2H) followed by immunofluorescence against DA (red) revealed double-labeled cells in the PT (arrows), similar to our data based on TH immunofluorescence (Fig. 1 H–N). (M and N) Magnifications of the dashed rectangles in J and L. In I and K, the circled regions illustrate the DA+ cells that were not labeled with TH immunofluorescence in our material (compare with Fig. 1 I and K). Data from B–D, F, G, and I–N were obtained from four different preparations. Cb, cerebellum; IT, isthmic tegmentum; OT, optic tectum.

