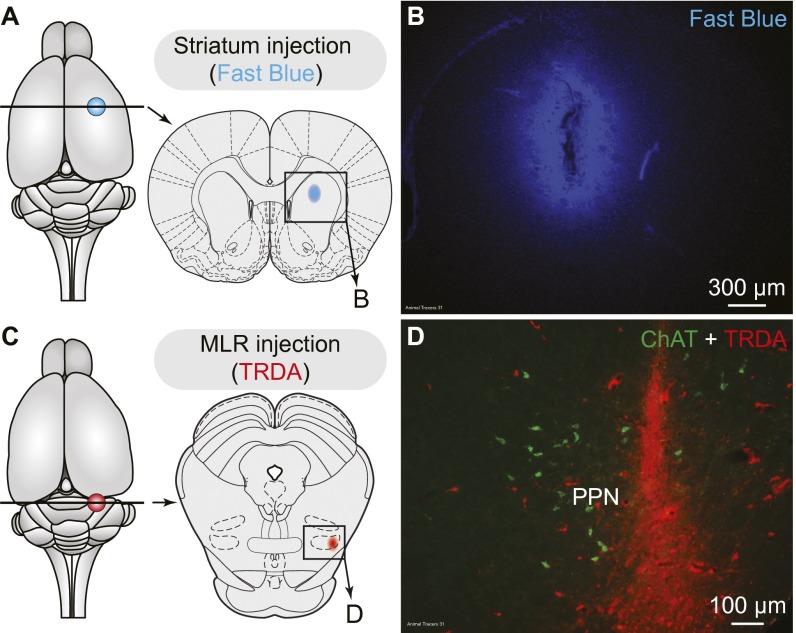
Fig. S7.
Histological controls for injection sites in the striatum (A and B) and MLR (C and D) in rats. (A) Schematic dorsal view of the rat brain. (Right) Diagram illustrating a cross-section at the level of the striatum, with the approximate location of the photomicrograph shown in B. (B) Typical injection site in the striatum of the retrograde tracer Fast blue (blue). (C) Same representation is in A, but this time the cross-section is at the level of the MLR. The approximate location of the photomicrograph in D is shown. (D) Typical injection site in the MLR of the retrograde tracer TRDA (red) at the level of the cluster of cholinergic cells (i.e., positive for ChAT, green) of the PPN (Fig. 4D), where a large number of dopaminergic fibers was observed (Fig. 4E and Fig. S4). Data from A–D were obtained from the same animal.

