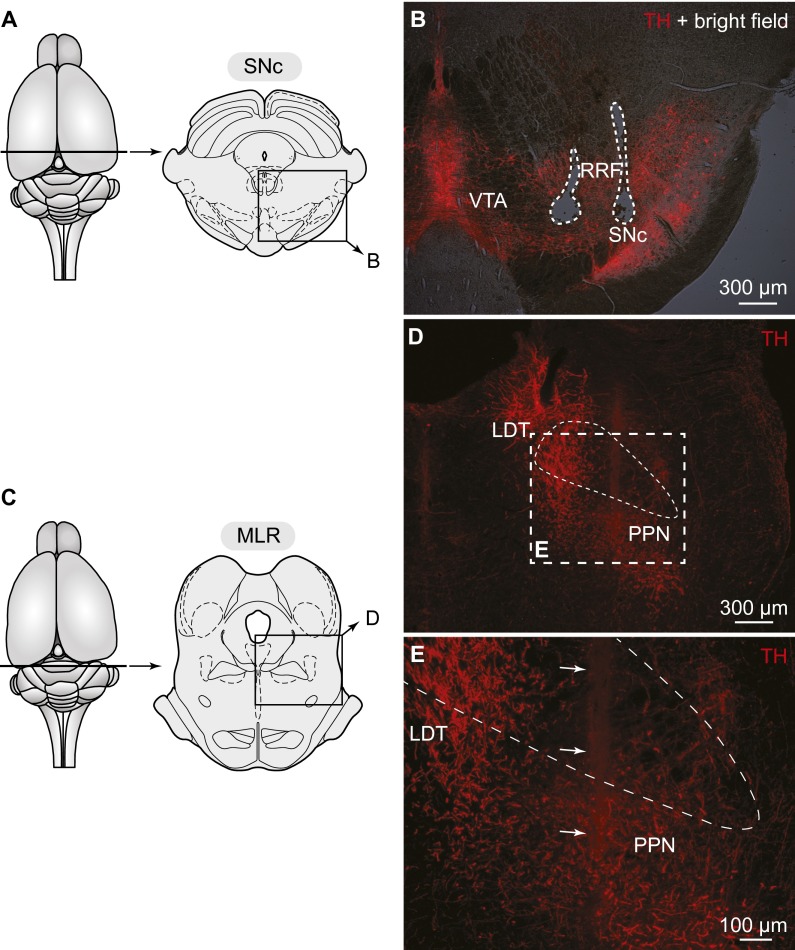
Fig. S8.
Histological controls for stimulation (A and B) and voltammetry recording sites (C–E) in rats. (A) Schematic dorsal view of the rat brain. (Right) Diagram illustrating a cross-section at the level of the SNc and RRF. The approximate location of the photomicrograph in B is shown. (B) The stimulation site in the SNc/RRF region was identified by an electrolytic lesion made with the bipolar electrode (enclosed by white dashed lines) at the end of the experiment. The stimulation site coincided with the location of TH+ neurons (red) of the SNc and RRF. (C) Same representation as in A, but this time at the level of the recording site in the MLR. (D and E) The electrolytic lesion made with the voltammetry electrode in the PPN is highlighted by white arrows in E, which illustrates a magnification of the dashed rectangle in D. The location where dopamine release was detected coincides with the location of the cholinergic cells of the PPN (Fig. 4D), where the dopaminergic innervation was observed (Fig. 4E and Fig. S4). The superior cerebellar peduncle is delineated with thin dashed lines in D and E. LDT, laterodorsal tegmental nucleus.

