Fig. 3.
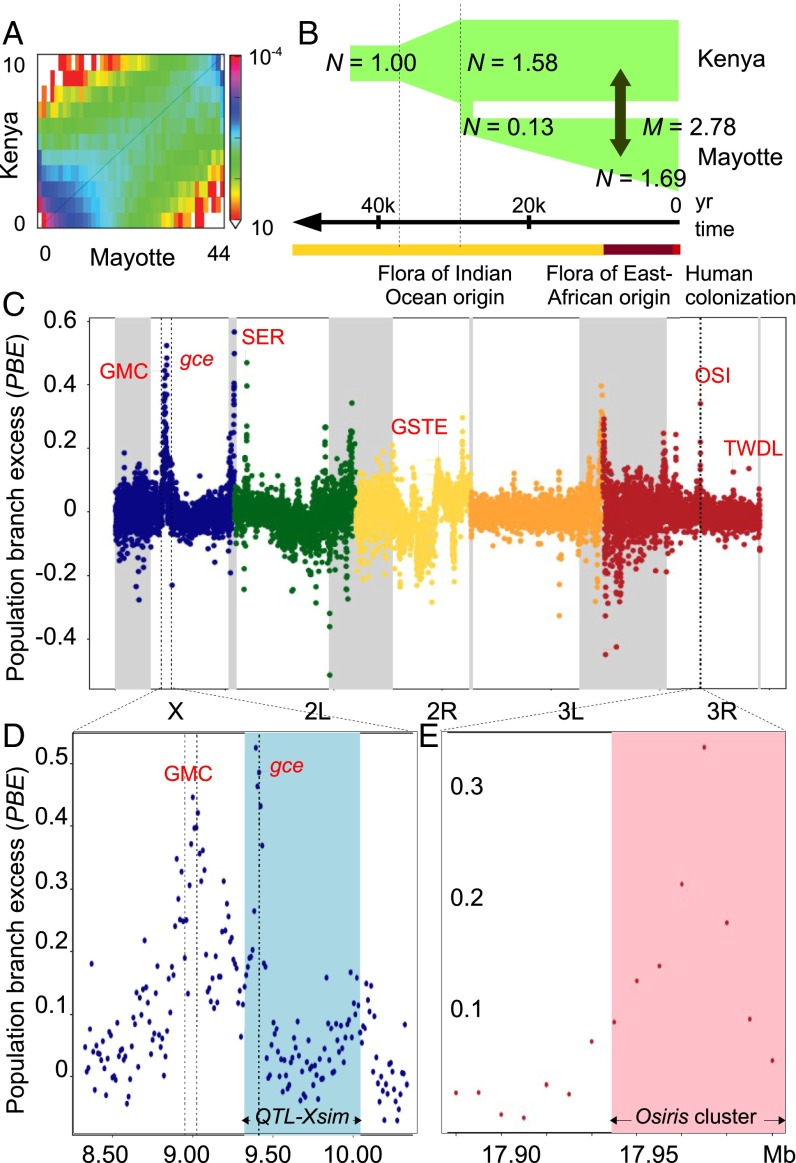
Demographic history of and selection traces on the genome of Mayotte D. yakuba. (A) Plot of allele frequency spectrum of D. yakuba from Mayotte and Kenya. (B) Illustration of the best-fit demographic model showing estimates of changes in size (N), the time of the split between Mayotte and Kenya and migration rate (M), compared with the floristic history of Mayotte (41). (C) Plot of average PBE per 10-kb nonoverlapping window in the Mayotte population. Note that PBE is positive when Mayotte-specific genetic differentiation exceeds its predicted value and may be negative if selection has acted in another population. Low recombining centromeric regions are highlighted in gray. (D) PBE values at the most differentiated region on the X chromosome with the major D. sechellia larval noni toxin tolerance QTL_simX (21) highlighted in blue. (E) PBE values at the major D. sechellia adult noni toxin tolerance QTL (19) with the Osiris genes cluster highlighted in pink. Major gene or gene cluster at the top of each divergence peak that are discussed in the text are given in red with clusters abbreviated: GMC, glucose–methanol–choline oxidoreductases; GSTE, GST E; OSI, Osiris proteins; SER, serine proteases; TWDL, Tweedle proteins.

