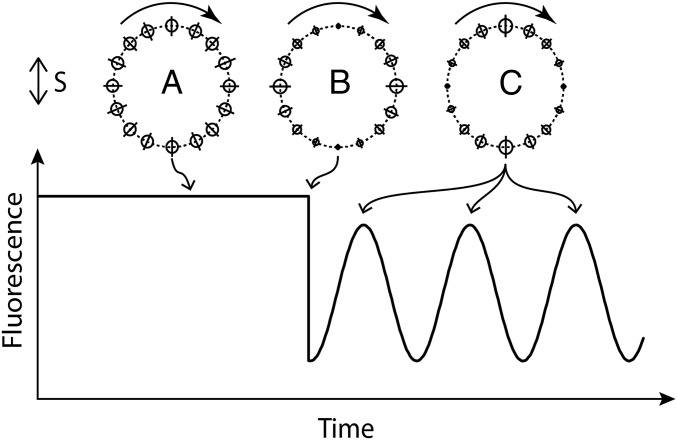
Fig. 2.
A schematic diagram of the experiment showing the polarization of the probe and bleaching beams (S), the ring of fluorophores before bleaching (a), the ring of fluorophores immediately after bleaching (b), the ring of fluorophores one-quarter and successive one-half turns later (c), and the fluorescence emission intensity expected as a function of time.

