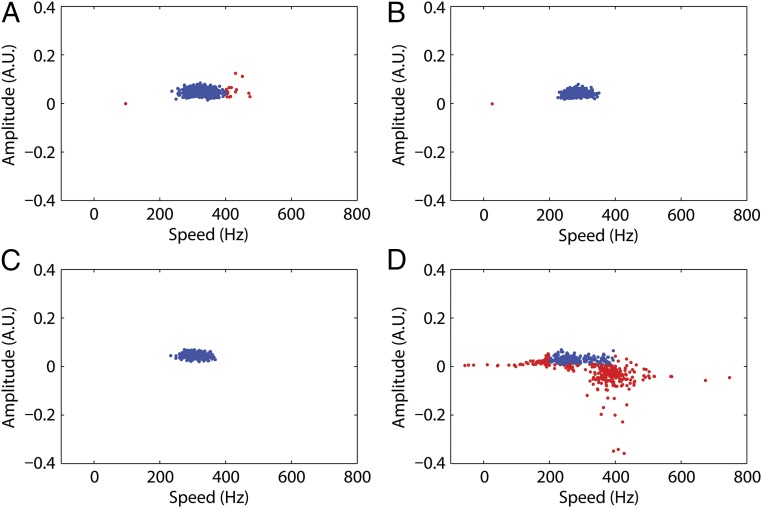
Fig. 4.
Parameters obtained from the bootstrap fits: speed vs. amplitude. Blue points indicate parameters within the confidence intervals 200–400 Hz (speed) and 0.01–0.1 arbitrary units (amplitude). Red points indicate parameters outside these confidence intervals. The percentages of fits within the confidence intervals were (A) 97% for the 300-μs bleaching pulse, (B) 99.8% for the 450-μs bleaching pulse, (C) 100% for the combined dataset, and (D) 34.2% for the control experiments. The means and SDs for the blue points in A–C were 325.8 ± 30.6, 284.8 ± 22.4, and 306.2 ± 20.8 Hz, respectively.

