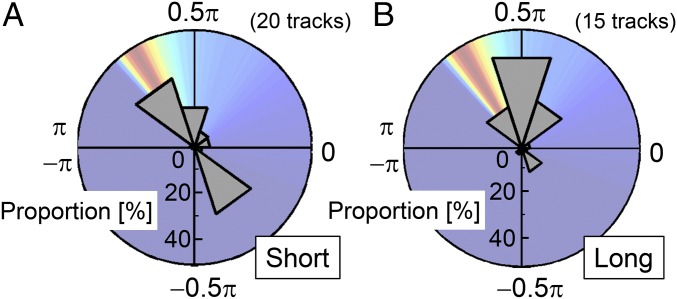
Fig. 4.
Results of parameter estimation. (A and B) Circular histograms of the γh distribution during two consecutive captures with short (A) and long (B) time intervals. Data were taken from 20 (A) and 15 (B) reconstructed flight tracks of bats when approaching prey 1. The points to calculate the distributions were 1,161 (A) and 820 (B), respectively. The calculated success rate distribution, which is shown in Fig. 2B, is displayed behind the histogram.

