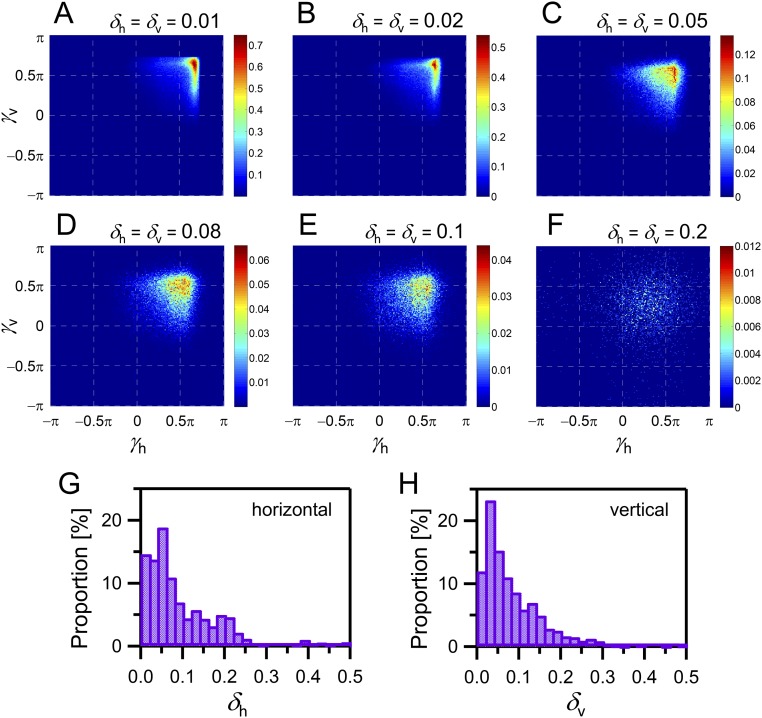
Fig. S3.
Results of the numerical simulations for the other δh and δv. (A–F) Rates of successful capture of two successively close targets within 10 cm (corresponding to wing length of the bat) without losing sight of the immediate target as functions of γh and γv [δh and δv = 0.01 (A), 0.02 (B), 0.05 (C), 0.08 (D), 0.1 (E), and 0.2 (F)]. The color bar at the right of each distribution indicates the success rate of each result. A total of 500 trials were simulated for each parameter set with the 0.01π step. (G and H) Distributions of δh (G) and δv (H) during the approach phase estimated using experimental data. The numbers of points used to calculate the distributions were 1,161 (G) and 1,251 (H).

