Fig. 1.
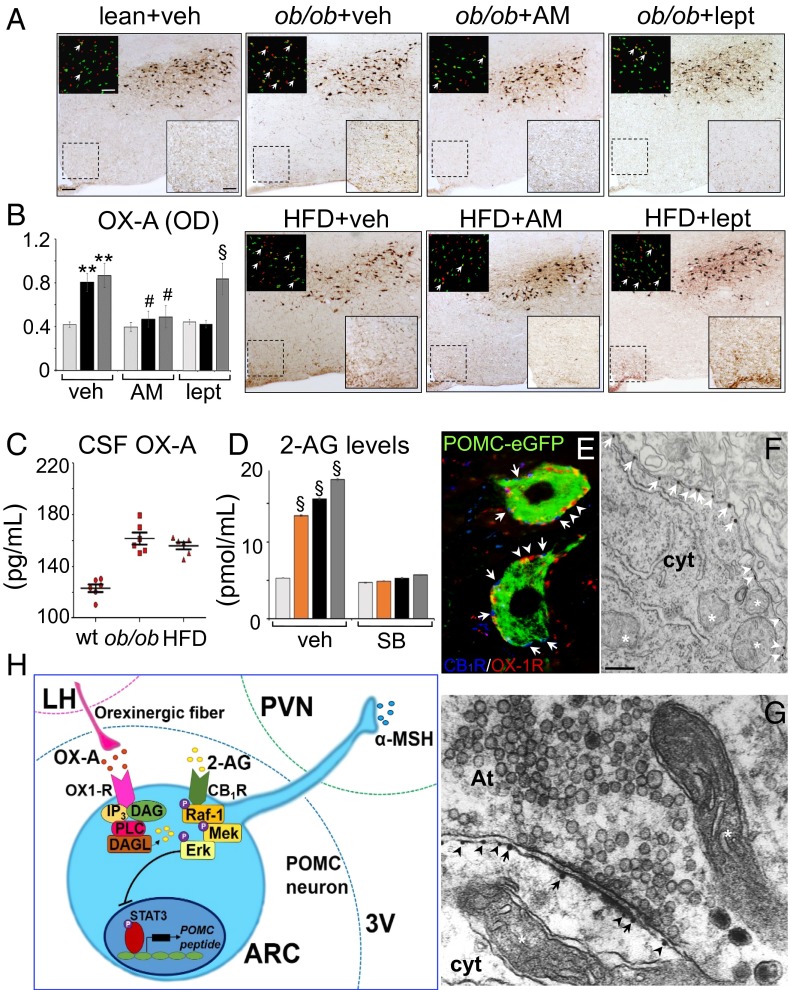
OX-A increases in the fibers of the ARC of obese mice enhancing 2-AG biosynthesis. (A) Representative coronal sections of similar rostrocaudal position of the LH and ARC (scale bar: 100 µm) showing labeled fibers and puncta in the ARC (high magnification of the respective boxed area; scale bar: 50 µm) and cFOS/OX-A costaining in the LH (Insets; scale bar: 100 µm). (B) Bar graphs of OX-A peroxidase-based optical density (OD, arbitrary units) in the ARC of lean (light gray bars), ob/ob (black bars), or HFD (dark gray bars) mice. **P < 0.005 vs. vehicle-injected lean mice; #P < 0.05 vs. AM251-injected mice. §P < 0.005 vs. leptin-injected lean mice. (C) OX-A levels in the CSF. (D) 2-AG levels in the ARC of lean (light gray bars), OX-A–injected lean (orange bars), ob/ob (black bars), or HFD (dark gray bars) mice reversed by SB334867 treatment. §P < 0.0005 vs. vehicle-injected lean mice. (E and F) CB1R and OX-1R immuno-coexpression in POMC neurons. CB1R and OX-1R electron microscopy immunogold detection at the plasma membrane (F) and postsynaptic side (G) of POMC neurons. CB1R (arrows) and OX-1R (arrowheads). At, axon terminal; cyt, cytoplasm; mitochondria are indicated by the asterisk [scale bar: 10 µm (E); 0.2 µm (F and G)]. Data are means ± SEM; n = 6 mice per group fed ad libitum. Statistical analysis was performed by two-way ANOVA followed by the Bonferroni post hoc test. (H) Scheme of the molecular pathway underlying CB1R activation, and subsequent transcriptional blockade of POMC expression, via OX-A–induced 2-AG production. 3V, third ventricle; DAG, diacylglycerol; IP3, inositol triphosphate; MEK, mitogen-activated protein kinase; OX1-R, orexin receptor type-1; PVN, paraventricular nucleus; Raf-1, protein kinase.

