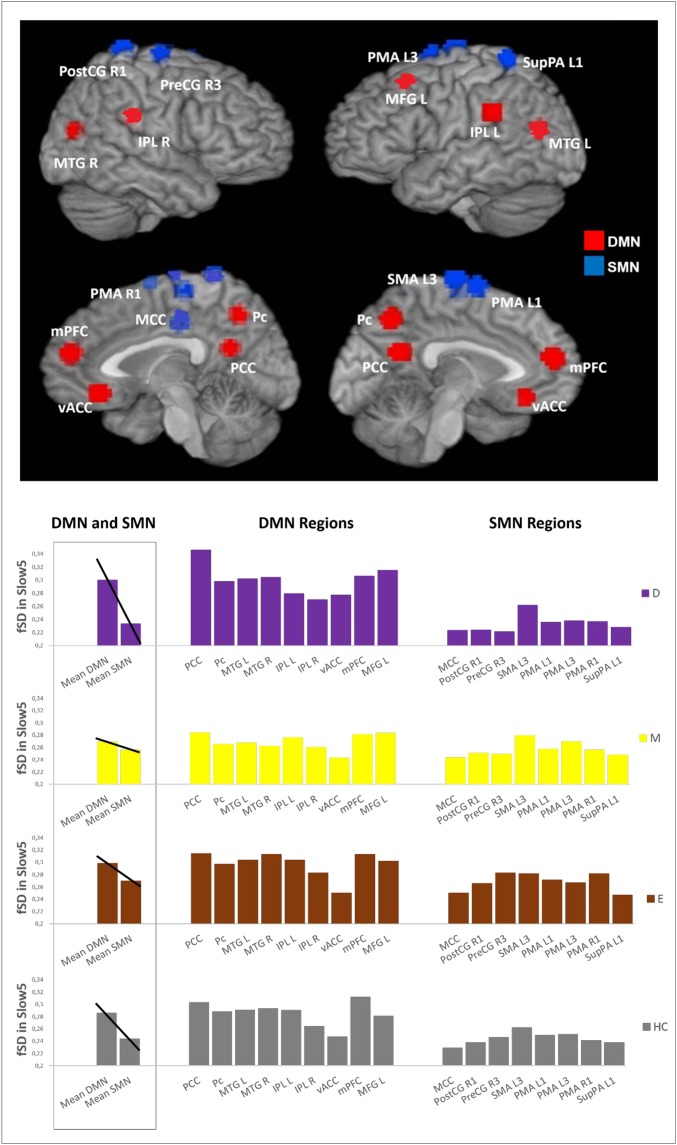
Fig. 2.
Differences in the DMN/SMN balance in the various subgroups. The Upper part of the figure is a global view of the DMN (red) and SMN (blue) regions. The Lower Left of the figure is the mean of the fSD values in Slow5 of the DMN and SMN, together with a visual trend of the balance between the DMN and SMN, for each subgroup. The Lower Right of the figure is the mean fSD values in Slow5 of the various regions belonging to the DMN and SMN, for each subgroup. D, depressive patients; E, euthymic patients; HC, healthy controls; IPL L, inferior parietal lobule left; IPL R, inferior parietal lobule right; M, manic patients; MCC, middle cingulate cortex; MFG L, middle frontal gyrus left; mPFC, medial preFrontal cortex; MTG L, middle temporal gyrus left; MTG R, middle temporal gyrus right; Pc, precuneus; PCC, posterior cingulate cortex; PMA L1, premotor area left; PMA L3, premotor area left; PMA R1, premotor area right; PostCG R1, postcentral gyrus right; PreCG R3, precentral gyrus right; SMA L3, supplementar motor area left; SupPA L1, superior parietal area left; vACC, ventral anterior cingulate cortex.

