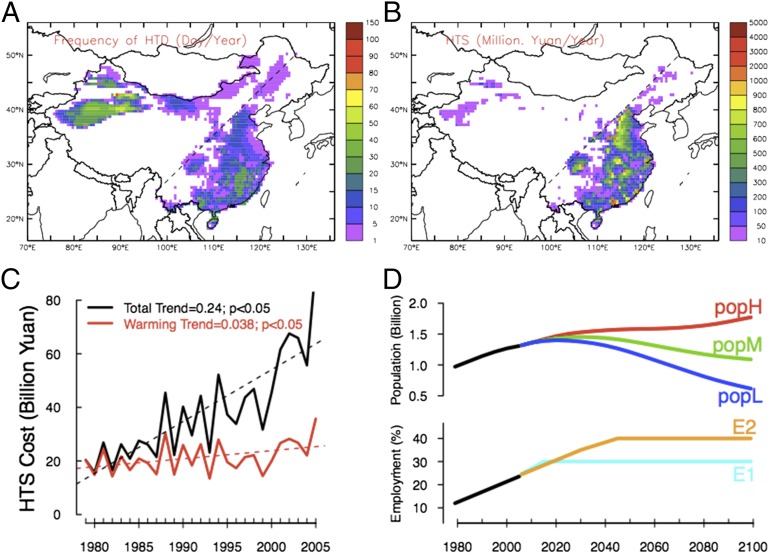
Fig. 1.
HTDs and HTSs in China over the 1979–2005 period based on the WFDEI dataset. (A) Multiyear mean of the annual frequency of HTDs. (B) Multiyear mean of estimated HTS. In A and B, the black dashed line indicates the Hu line. (C) Evolution of the HTSCHN accounting for both climatic and socioeconomic drivers (total trend; black) or the climatic driver alone (warming trend; red; i.e., assuming that the population and employment structure have remained as they were in 1979 over the entire period). Both trends are statistically significant at the 5% level according to the Mann–Kendall test and Sen’s slope estimates. (D) Evolution of the population size and number of formal employees under the selected scenarios.

