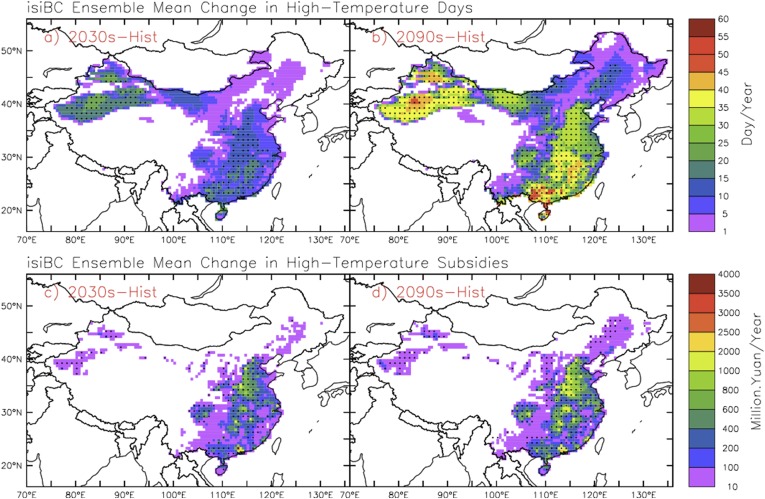
Fig. 2.
Change in HTDs and HTSs in China in the near and far future (2020–2039 and 2080–2099, respectively) relative to the present day (1979–2005) under isiBC RCP4.5 projections, a medium population projection, and E1 employment scenarios. (A and B) Ensemble mean change in the annual frequency of HTDs in the 2030s and 2090s. (C and D) Ensemble mean change in HTSs in the 2030s and 2090s. The grids with significant changes (more than 1 SD) appear as dots. Hist, history.

