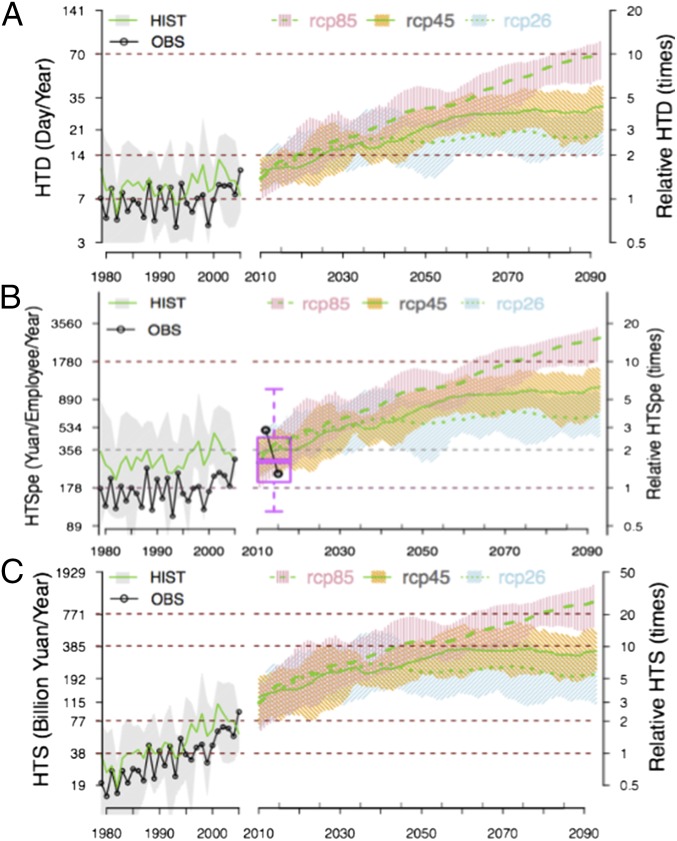
Fig. 3.
Estimated evolution of HTDs, HTSPE, and HTSCHN with isiBC between 1979 and 2099. (A) Population-weighted HTDs (days per year). (B) HTSPE (yuan per employee per year). (C) Total HTSCHN in billion yuan per year under the popM and E1 scenarios. Black circles indicate the WFDEI-based reference (OBS, observation), and shaded areas show the span of the isiBC ensembles of five GCMs, with corresponding ensemble means shown as green lines (using 11-y running means from 2006 to 2100). The right y axis gives the relative change (multiplicative factor) compared with the 1979–2005 mean (horizontal purple dashed line). For ease of presentation, the projected HTS is the change in the modeled HTS plus the mean reference value. In B, the big black circles give HTSPE estimates based on meteorological station data in 2013 and 2014, and the whisker box gives the HTS statistics using the isiBC ensemble over these 2 y (5 GCMs × 3 RCPs × 2 y): from bottom to top, the five bars give the minimum; 25th, 50th, and 75th percentiles; and maximum. HIST, history.

