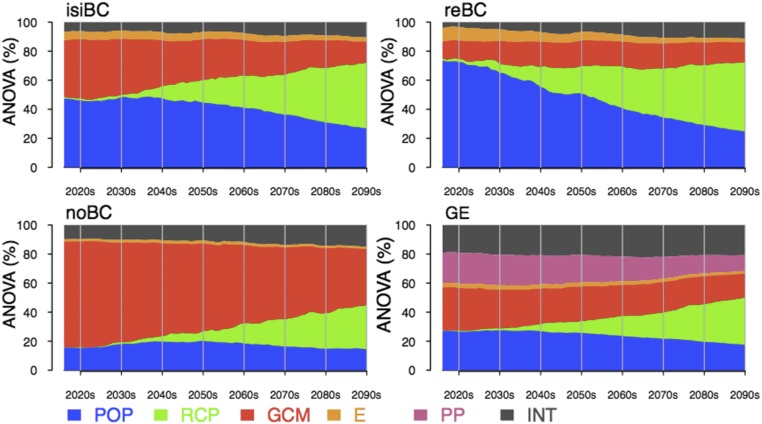
Fig. 4.
Evolution of the variance fraction of the HTSCHN attributed by ANOVA to population (POP), radiative forcing (RCP), GCMs, employment structure (E), postprocessing (PP), and the interactions among them (INT). isiBC, reBC, and noBC indicate that ANOVA was applied to isiBC, reBC, and noBC datasets; GE indicates that ANOVA was applied to the whole ensemble of the noBC, isiBC, and reBC datasets.

