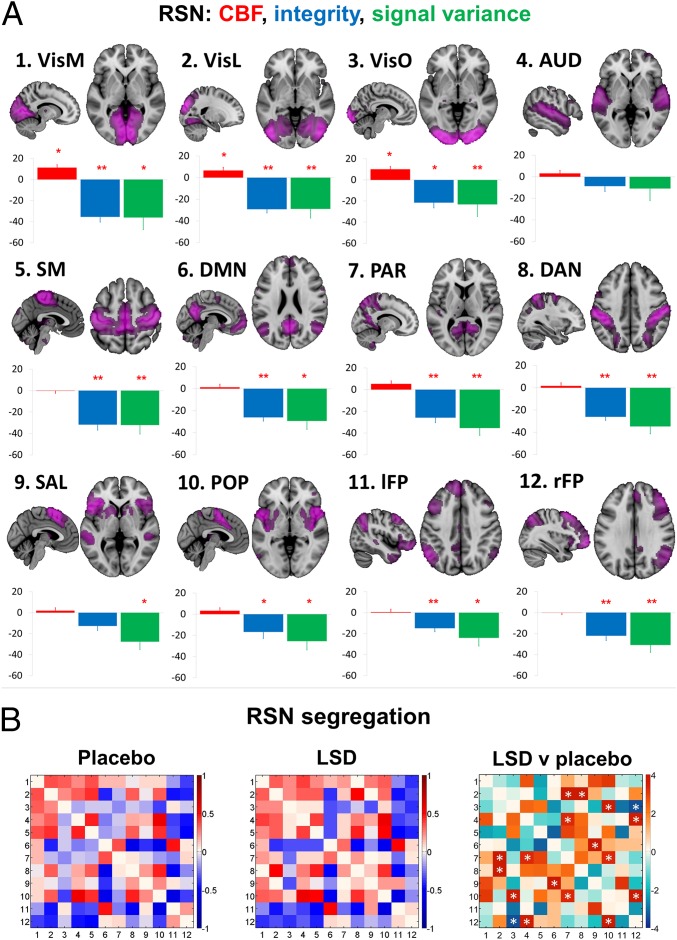
Fig. 4.
(A) Mean percentage differences (+SEM) in CBF (red), integrity (blue), and signal variance (green) in 12 different RSNs under LSD relative to placebo (red asterisks indicate statistical significance, *P < 0.05; **P < 0.01, Bonferroni corrected). (B) Differences in between-RSN RSFC or RSN “segregation” under LSD vs placebo. Each square in the matrix represents the strength of functional connectivity (positive = red, negative = blue) between a pair of different RSNs (parameter estimate values). The matrix on the far right displays the between-condition differences in covariance (t values): red = reduced segregation and blue = increased segregation under LSD. White asterisks represent significant differences (P < 0.05, FDR corrected; n = 15).

