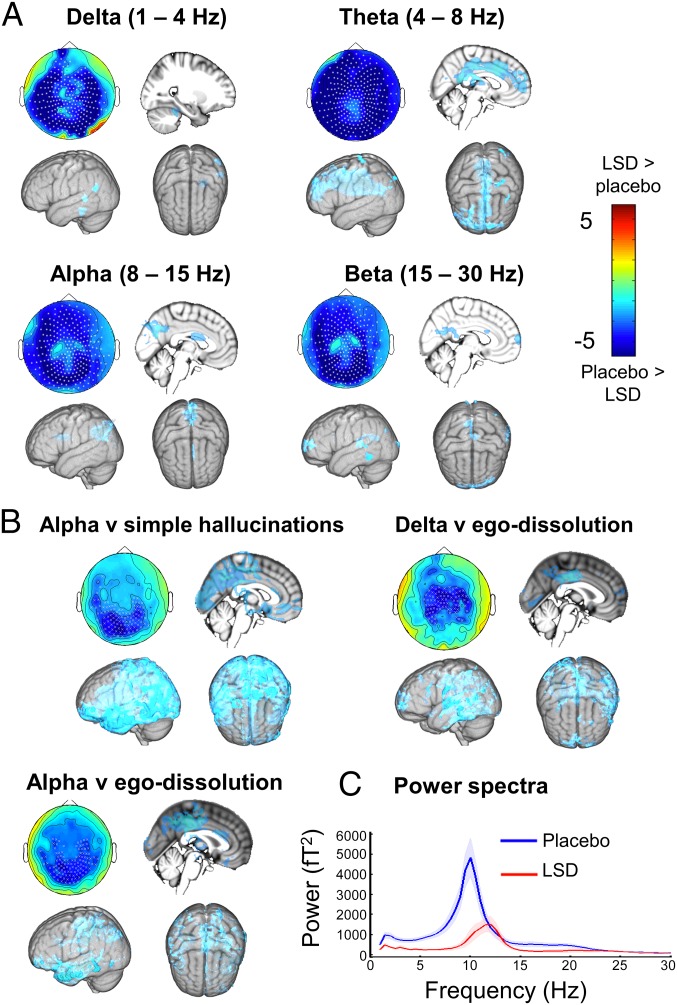
Fig. 5.
MEG results. (A) Statistical analysis of planar gradiometer-configured MEG data comparing LSD with placebo in the eyes-closed condition. Blue indicates less power under LSD. Units are t-statistics. Significant sensor clusters are marked such that stars correspond to P < 0.01 and crosses to P < 0.05 (corrected). Source localization results are also displayed. (B) Significant correlations between changes (decreases) in oscillatory power and subjective phenomena. (C) Power spectra for the significant sensor cluster in B (simple hallucinations), with placebo data plotted in blue and LSD in red (n = 14).

