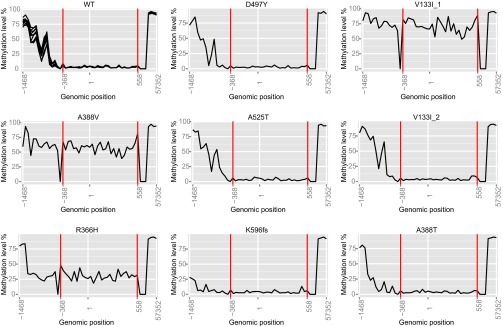
Fig. S3.
MLH1 promoter methylation in the eight tumors with SAMHD1 mutations. Methylation levels of the MLH1 promoter in percentage are presented as a line plot. The x axis represents 50 CpG sites covering the region 1,468 bp upstream to 57,352 bp downstream of the transcriptional start site (marked by “1”). Red lines specify the variable region where an increased methylation level indicates silencing of the MLH1 gene. WT represents data from nine normal colon samples. The V133I variant is found in two tumors and denoted V133I_1 and V133I_2.

