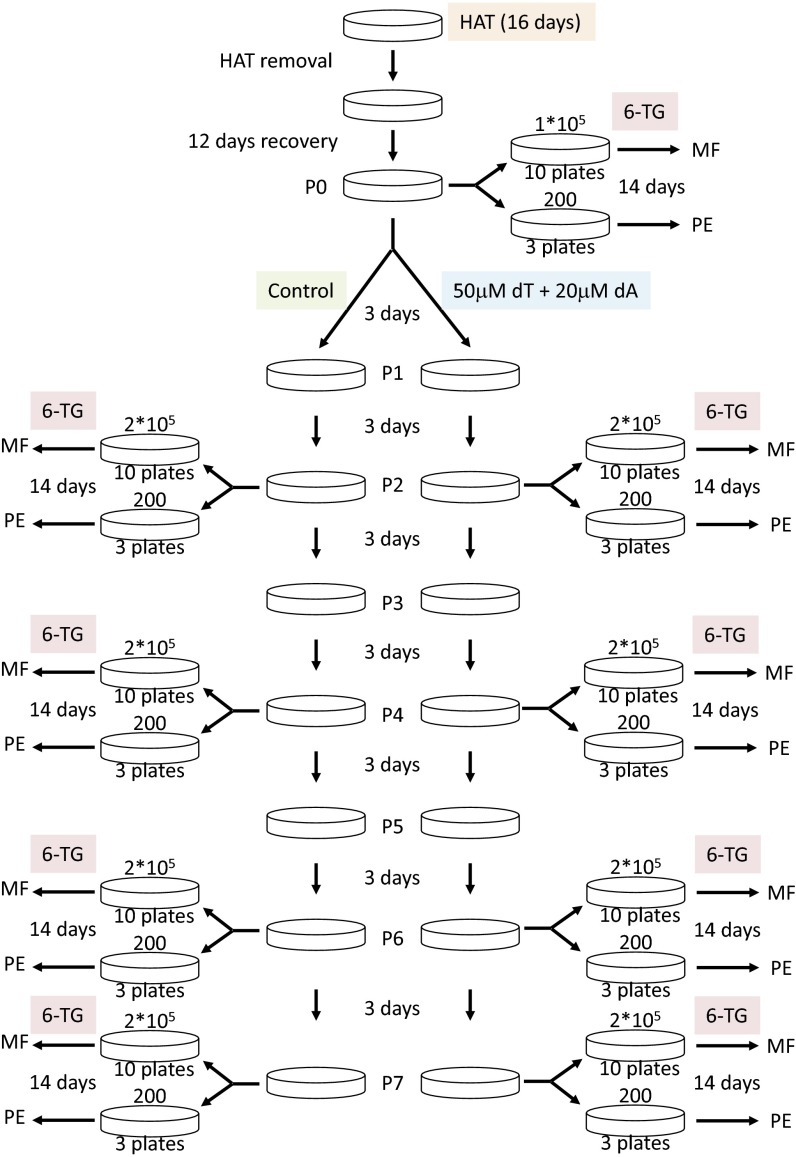
Fig. S5.
Schematic representation of the workflow of the experiment for calculating the mutation rates of the HPRT locus of the HCT116 cells in the presence or absence of 50 μM thymidine (dT) and 20 μM deoxyadenosine (dA). 6-TG, 6-thioguanine; HAT, hypoxanthine-aminopterin-thymidine; MF, mutation frequency; PE, plating efficiency. For details, see SI Experimental Procedures.

