Fig. 2.
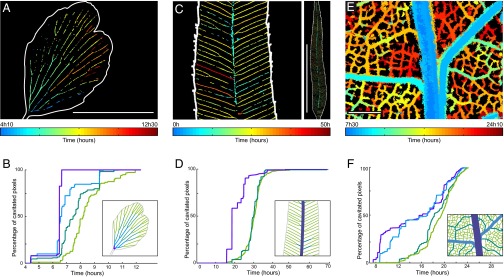
Spatiotemporal evolution of embolism formation in leaves exposed to acute water stress. (A) Adiantum: progression map of embolism in a single pinna. (Scale bar, 5 mm.) (B) Progression of embolism for different vein orders. (Inset) Definition of the colors of each order. (C and D) Embolism map for the fern Pteris and progression of emboli for the whole leaf; the orders are here defined in the usual way from the petiole. (Left) Zoom. (Right) Whole leaf. (Scale bar, 50 mm.) (E and F) The same for Quercus. Colors represent the first embolism. See Fig. S4B for the progression of embolism in a whole Quercus robur leaf. (Scale bar, 1 mm.)

