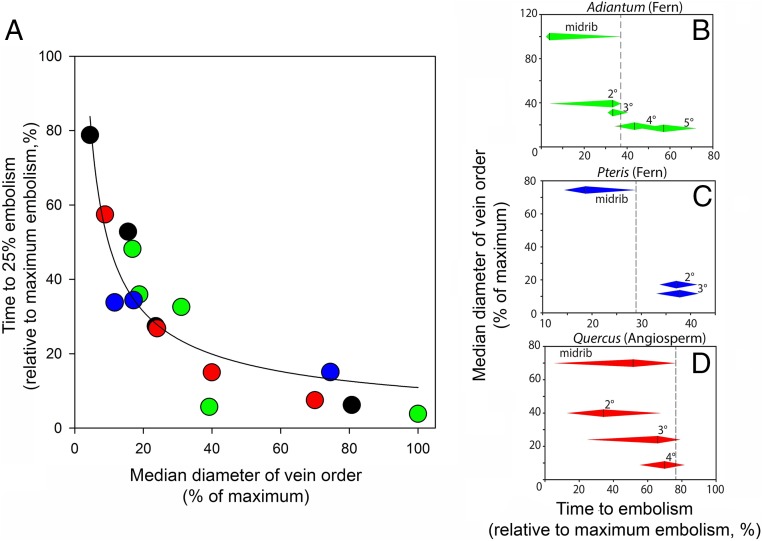
Fig. 3.
Normalized plot showing that within each leaf, the larger vein diameters are the first to embolize. (A) Relative vein sizes (in each species, the sizes of vein orders are expressed relative to the largest vein size) and time to embolism (in each species, the time for 25% embolism of each vein order is expressed relative to the time to 99% embolism of all veins) are plotted for two ferns (Adiantum, green; Pteris, blue) and two angiosperms (Quercus, red; Eucalyptus, black). The median vein diameter D of the considered order is normalized by Dmax, the maximum vein diameter in the corresponding leaf. The time T25 to reach 25% of vein order embolism is normalized using (T25 − Tmin)/(Tmax − Tmin), where Tmin and Tmax are times for 1% and 99% embolism in the whole leaf, respectively). A best-fit regression with the equation T25 = k/D is fitted to all points. (B–D) Overlap between vein orders in terms of timing of embolism is shown for species with contrasting vein architectures (note that axes are inverted compared with A to emphasize functional overlap between veins). The dotted line shows the point in time where the midrib is completely cavitated, and leaves are no longer able to function. Diamonds for each vein order extend between times for 25th–75th percentile embolism for the particular vein order.

