Fig. 5.
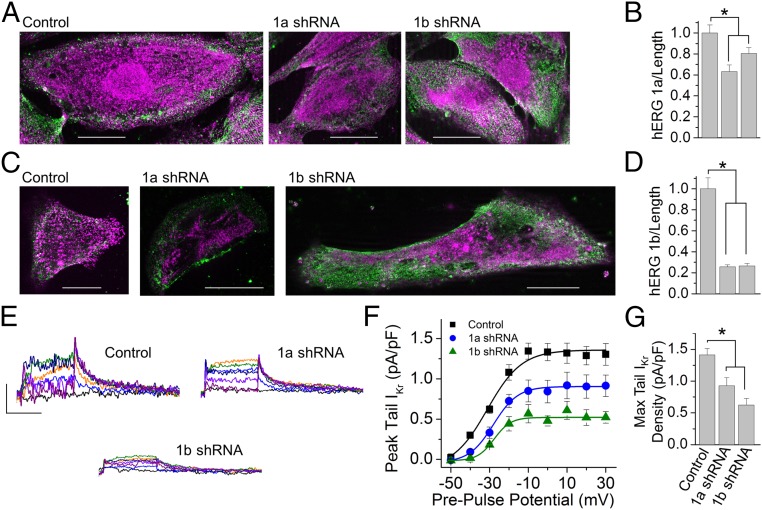
shRNA knockdown in cardiomyocytes targets mRNA undergoing protein translation. (A) hERG 1a (magenta) and β-actin (green) immunofluorescence from iPSC-CMs transfected with nontargeting shRNA (Left, Control), 1a shRNA (Middle), or 1b shRNA (Right). (Scale bars: 20 μM.) (B) Quantification of data represented in A shows 1a fluorescence (mean ± SEM) was significantly reduced by either 1a- or 1b-specific shRNA compared with nontargeting control shRNA, indicating a reduction of hERG 1a protein (n = 17–21 cells). P ≤ 0.02. (C) hERG 1b (magenta) and β-actin (green) immunofluorescence from iPSC-CMs transfected with nontargeting shRNA (Left, Control), 1a shRNA (Middle), or 1b shRNA (Right). (Scale bars: 20 μM.) (D) Quantification of data represented in C shows 1b fluorescence was significantly reduced by either 1a- or 1b-specific shRNA compared with control cells, indicating a reduction of hERG 1b protein (n = 19–22 cells). P < 0.001. (E) IKr measured as E-4031–sensitive membrane currents recorded from iPSC-CMs transfected with nontargeting shRNA (Left, Control), 1a shRNA (Right), or 1b shRNA (Lower). (Scale bars: 0.5 pA/pF by 2 s.) (F) Quantification of peak tail current represented by traces in E plotted as a function of prepulse potential and fitted with a Boltzmann function for IPSC-CMs transfected with nontargeting control shRNA (black), 1a shRNA (blue), and 1b shRNA (green). (G) shRNA transfection significantly reduced peak tail IKr density (n = 4–9 cells). Max, maximum. P ≤ 0.02. Statistical significance was assessed using an ANOVA and a Bonferroni post hoc t test. *P < 0.05.

