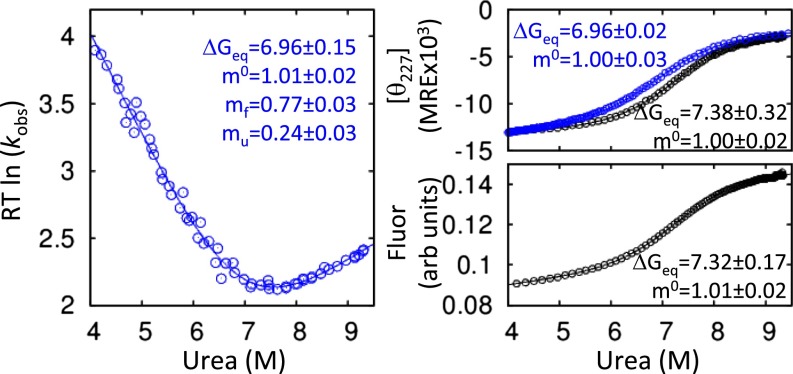
Fig. 1.
Folding behavior of λYA. Chevron plot of folding and unfolding rate constants using tryptophan fluorescence (Left) and chemical denaturation monitored using fluorescence and CD (Right), obtained in 100% H2O (blue) and 80% D2O (black, as used in HX measurements). Units for ΔG and m are kcal·mol−1 and kcal·mol−1·M−1, respectively.

