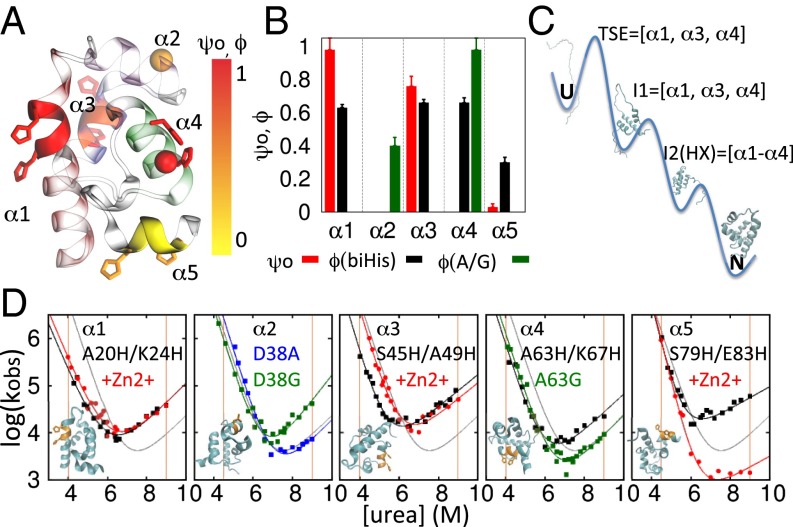
Fig. 4.
ψ, ϕ analysis. (A) The ψ0, ϕ values are mapped onto the protein structure by coloring the biHis side chains and ribbon according to the associated ϕbiHis and ψ0 values, respectively. The D38 and A63 Cα atoms are denoted with colored spheres according to their ϕA→G values. (B) Measured ψ, ϕ values. (C) Proposed folding pathway. The 310 helix is not shown for simplicity and lack of information; HX measurements are consistent with it forming before α2. (D) Chevron plots. Shown are biHis mutant data without (black) and with 1 mM Zn2+ (red) and glycine (green) and alanine (blue) variants; orange vertical lines designate the [urea] at which ΔΔGf and ΔΔGu are used for the ψ calculation, obtained by simultaneously folding and unfolding data (SI Materials and Methods).

