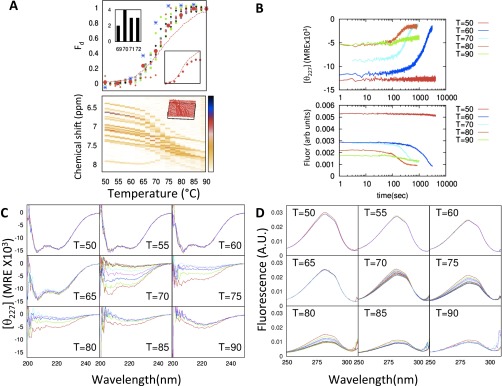
Fig. S2.
λYA aggregation at high temperature. (A, Upper) Population fraction of the denatured state during temperature melting measured by CD (red line is with aggregation and red circles are after removing aggregation effect) and fluorescence (blue), and 1D NMR chemical shifts of hydrogens in aromatic residues. Upper Left Inset shows distribution of Tm for 1D NMR data, and Lower Right Inset shows raw data for CD. (A, Lower) One-dimensional NMR chemical shifts of hydrogens in aromatic residues from T = 50 °C to T = 90 °C with 2 °C increment. (B) The CD and fluorescence data at T = 323–363 K show a decrease in signal, suggesting that λYA aggregates at high temperature. (C and D) Corresponding CD (C) and fluorescence (D) spectra at different times, separated by ∼1 min.

