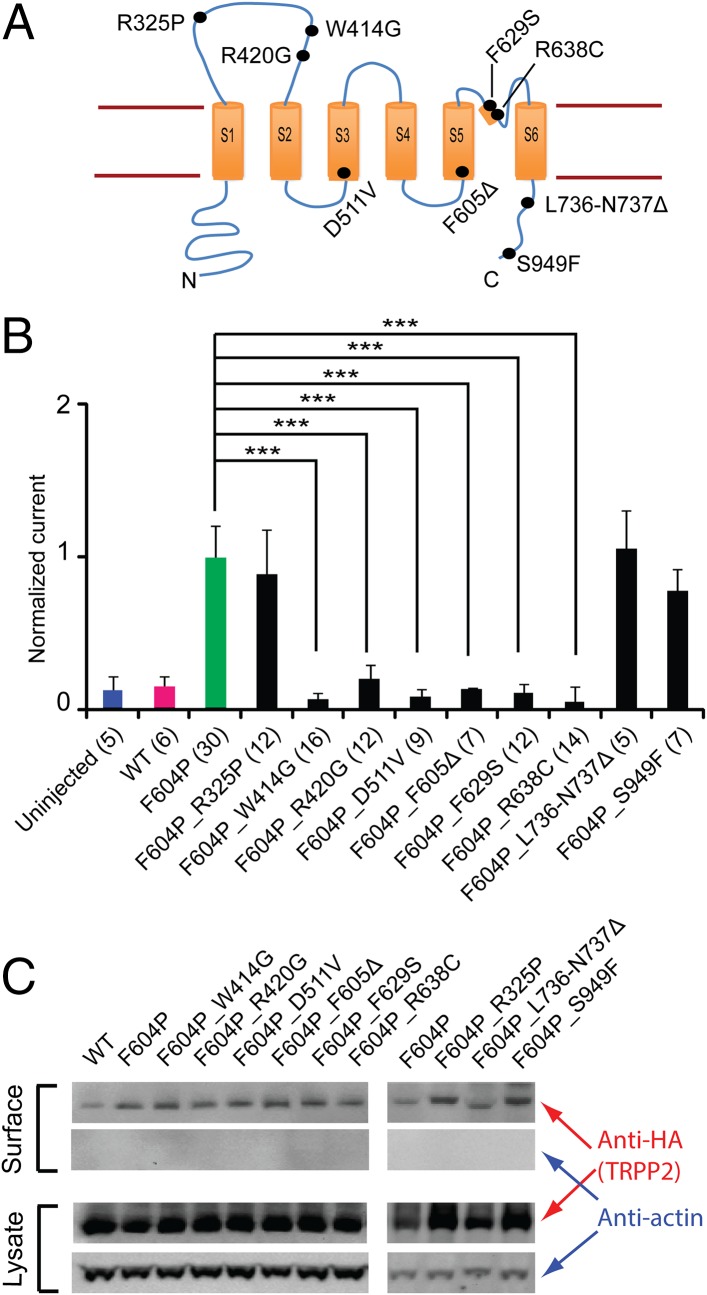
Fig. 5.
Effects of ADPKD pathogenic mutations on GOF TRPP2 channel activity. (A) Topology of TRPP2 with indicated positions (black dots) of nine pathogenic single- or double-point mutations tested in this study. (B) Bar graph showing the effect of the tested pathogenic mutants on TRPP2_F604P current. Currents were recorded in a bath solution containing 100 mM NaCl, 2 mM CaCl2, and 2 mM Hepes-NaOH (pH 7.5). Currents at +60 mV are shown in the bar graph. All currents have been normalized to the average of TRPP2_F604P currents recorded from the same batch of oocytes. Currents of F604P_D511V and F604P_F605Δ are adopted from data in Fig. 2D. ***P < 0.001. (C) Representative Western blot images showing surface expression of the WT TRPP2 channel and channels with indicated mutations. Actin was blotted to show only surface protein detected in the surface protein samples, and serves as a loading control. Statistical analysis on band intensity with data from three independent experiments shows no significant difference in their plasma membrane expression (Fig. S6).

