Fig. 6.
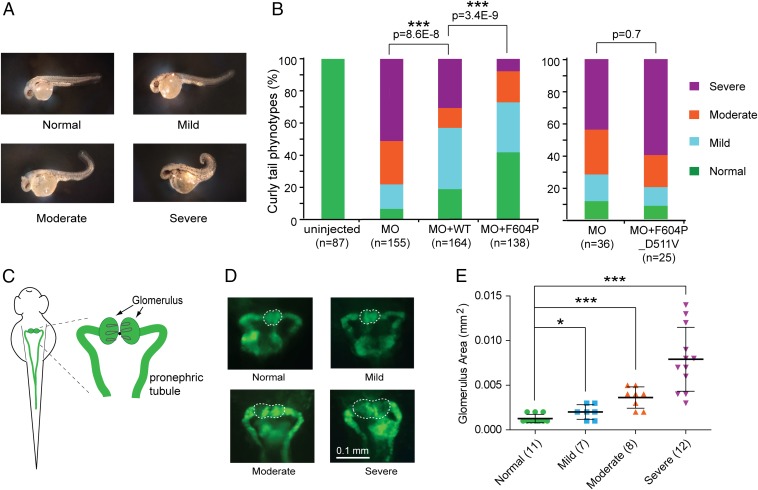
GOF TRPP2 rescues the dorsal axis curvature (curly tail) phenotype in zebrafish embryos better than WT TRPP2. (A) Representative images of zebrafish embryos showing the range of severity in curly tail used for scoring. Normal: no curvature; mild: <90°; moderate: >90°; severe: tail tip crossing the body axis. (B) Bar graph represents the percentage of embryos with normal, mild, moderate, and severe curvature at 48 hpf. Embryos were injected at the one-cell stage with zebrafish TRPP2 MO or indicated combinations of MO and RNA. Statistical significance is determined by the χ2 test. Data used in the Left bar graph were pooled from five independent experiments, whereas data used in the Right bar graph were pooled from two experiments. (C) Diagram showing fish pronephric kidney at around 48 hpf. (Right) Glomerulus and pronephric tubule are labeled on the zoom-in diagram. (D) Representative fluorescence images showing the area of the glomerulus (circled with dashed lines) of zebrafish embryos with different severity in dorsal axis curvature as shown in A. The transgenic line wt1b:EGFP [Tg(wt1b:eGFP)li1] with pronephros-specific GFP expression was used in this experiment. (E) Scatter plot showing the correlation between glomerulus area and indicated curly tail severity. The glomerulus area was selected as shown with the dashed lines in D, and was measured with ImageJ. The mean and SD are indicated in the plot. *P < 0.05; ***P < 0.001.

