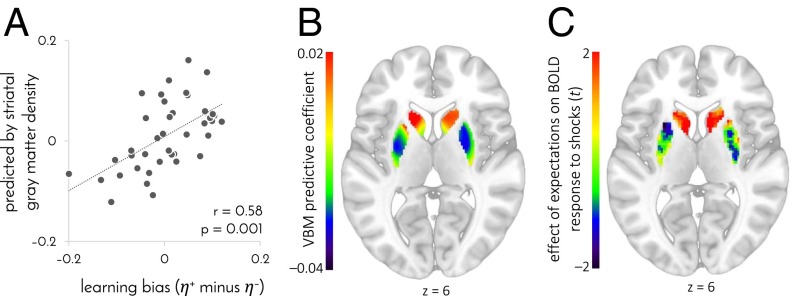
Fig. 4.
Striatal gray matter density predicts learning bias. n = 41 participants. (A) Learning bias predicted by gray matter density in the 6,315 voxels of the striatum as a function of the true learning bias inferred from participants’ choices. Learning biases were predicted from gray matter density by using cross-validated regularized linear regression. (B) Gray matter density coefficients used to predict learning bias. To create the map, predictive coefficients were averaged across participants and generalized across the striatum by assigning a fraction of each coefficient to each voxel proportionally to the gray matter-density variance shared between that voxel and the coefficient’s designated voxel. (C) Representation of expectations in the response to shocks. t values were computed by using a group-level GLM that included both negative learners, whose BOLD response was regressed against aversively signed prediction errors, and positive learners, whose BOLD response was regressed against appetitively signed prediction errors. There were no significant differences between positive and negative learners within the striatum (P > 0.5, FWE small-volume corrected). The map is masked for the volume of the striatum and not thresholded. z value in B and C denotes MNI coordinate.

