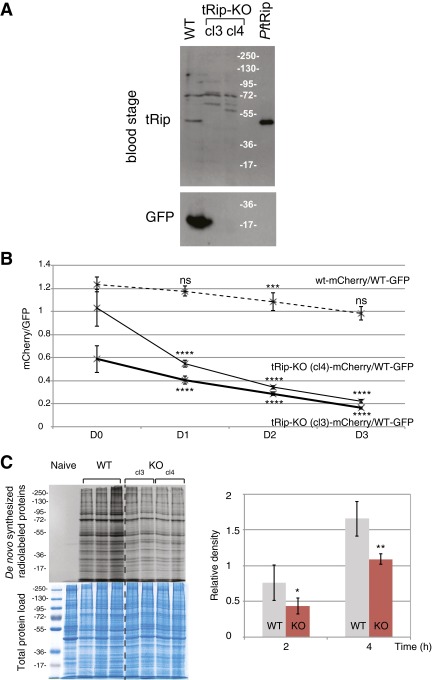
Fig. S6.
Phenotype of tRip-KO blood-stage parasites. (A) Western blot on blood-stage WT and tRip-KO (cl3 and cl4) parasites probed with anti-PftRip214–402. P. berghei blood stages were matured into schizonts in vitro before analysis. Additional bands around 72 kDa correspond to cross-reactive proteins from the host. (B) Ratio of mCherry+/GFP+ parasites in the blood of 4-wk-old mice coinfected by WT/mCherry+ and WT/GFP+ parasites (dashed line, n = 8) or tRip-KO/mCherry+ (cl3 and cl4) and WT/GFP+ parasites (plain lines, n = 15). Error bars are SDs, unpaired t test: ***P < 0.001, ****P < 0.0001; ns indicates that values are not significantly different (P > 0.1). (C) Protein synthesis by WT or tRip-KO P. berghei blood-stage parasites. Infected red blood cells with WT (n = 3, based on the number of mice), tRip-KO cl3 (n = 2), or tRip-KO cl4 (n = 2) parasites were metabolically labeled with [35S] methionine for 2 or 4 h at 37 °C. The level of de novo synthesized proteins was determined by SDS/PAGE autoradiography. Autoradiograms shown correspond to the 4-h time point. The magnitude of radiolabel incorporation was expressed as [35S] methionine incorporation into proteins relative to total protein load (Coomassie blue staining). Error bars are SDs, and asterisks indicate statistically significant differences (*P < 0.05, **P < 0.01) between the tRip-KO (red) and WT parasites (gray) translational activities.

