
. 2015 Nov 21;57(5):575–584. doi: 10.1111/jcpp.12486
© 2015 The Authors. Journal of Child Psychology and Psychiatry published by John Wiley & Sons Ltd on behalf of Association for Child and Adolescent Mental Health.
This is an open access article under the terms of the Creative Commons Attribution License, which permits use, distribution and reproduction in any medium, provided the original work is properly cited.
Figure 2.
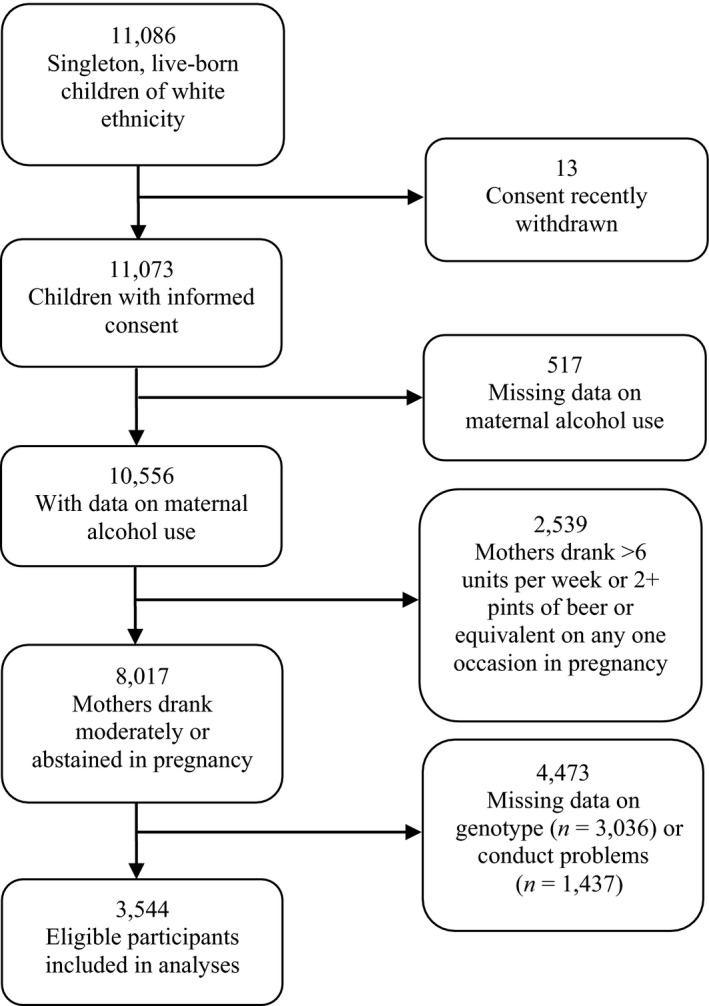
Flow chart of sample included in analyses