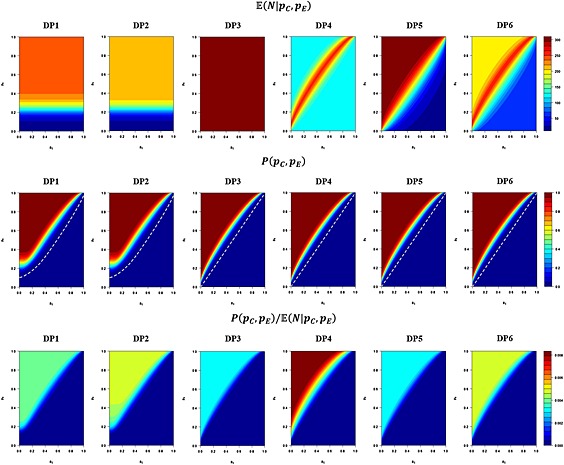
Figure 1.

Development plan performances for p 0=0.15, p 1=0.3, α = 0.0025, β = 0.36. The expected sample size; , powerl; P(p C,p E), and ‘power per patient’; , of the six development plans, across the complete possible range of true response rates in the control (p C) and treatment (p E) arms is depicted. The dotted white line in the P(p C,p E) plots indicates the contour P(p C,p E) = α.
