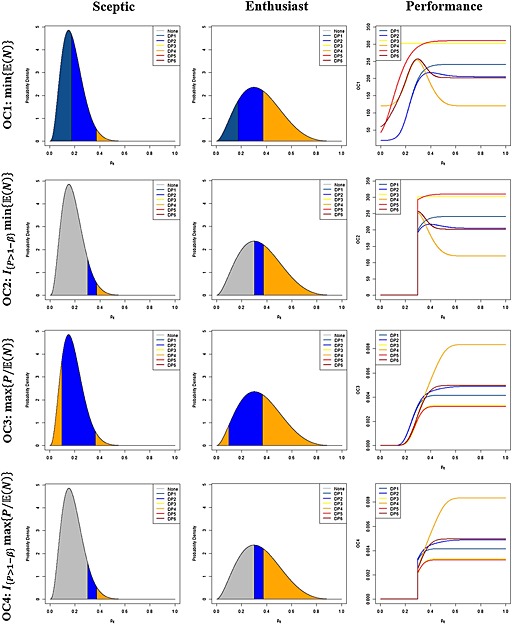
Figure 3.

‘Sceptic’ and ‘Enthusiast’ development plan distributions. Beta distributions depict the optimal development plans according to the optimality criteria (OC1–OC4), and being either a ‘sceptic’ or an ‘enthusiast’. Additionally, the performance of each development plan for each optimality criteria, across values of p E, is displayed.
