
Figure 2.
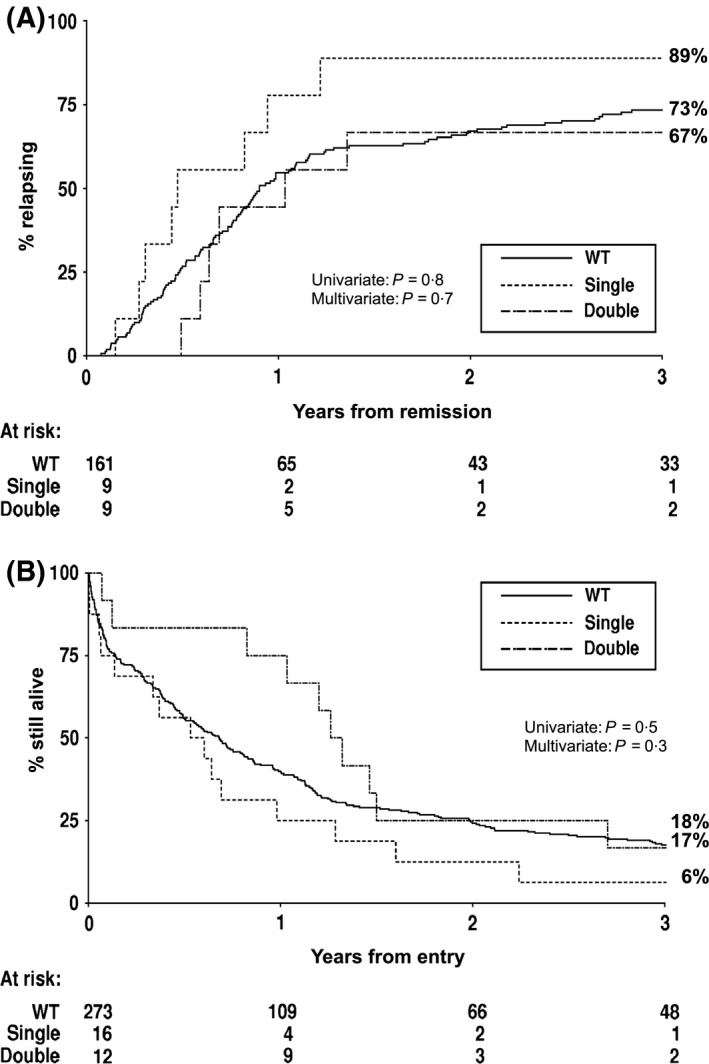
Kaplan–Meier curves stratified according to CEBPA genotype. (A) Cumulative incidence of relapse. (B) Overall survival. WT, wild type.
Official websites use .gov
A
.gov website belongs to an official
government organization in the United States.
Secure .gov websites use HTTPS
A lock (
) or https:// means you've safely
connected to the .gov website. Share sensitive
information only on official, secure websites.
Kaplan–Meier curves stratified according to CEBPA genotype. (A) Cumulative incidence of relapse. (B) Overall survival. WT, wild type.