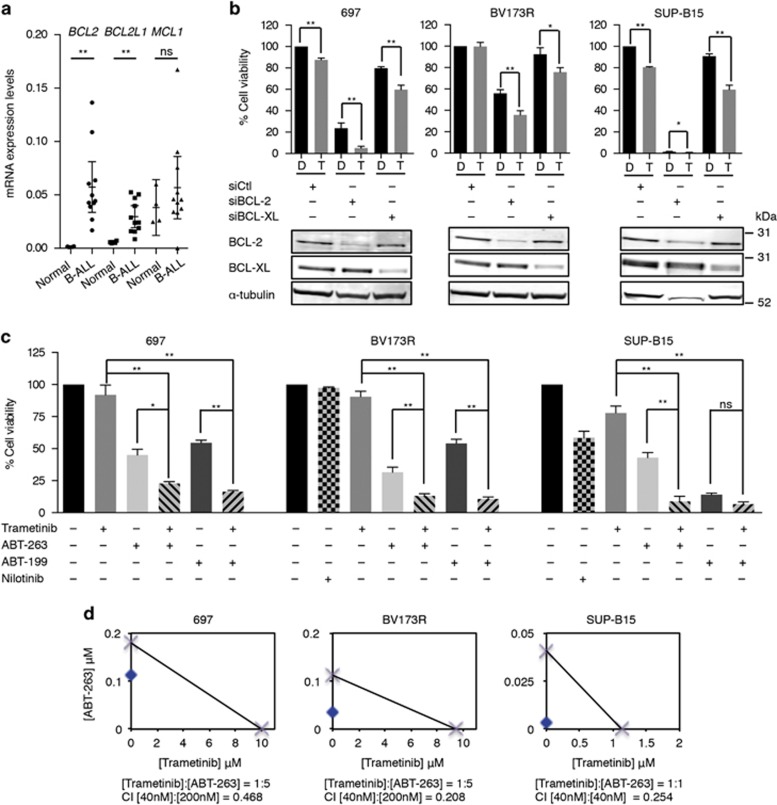
Figure 2.
MEKi and BCL-2i synergize to kill B-ALL cells. (a) Scatter dot plot showing mRNA expression for BCL2, BCLX (BCL2L1), and MCL1 relative to housekeeping gene control in the 11 B-ALL cell lines (Supplementary Table S1) and normal primary CD34+ cells. Error bars: mean with 95% confidence intervals. **P<0.01; NS, not significant. (b) Graphs showing cell viability (%) in 697, BV173R, and SUP-B15 cells transfected with control siRNA (siCtl), BCL-2 (siBCL-2), or BCL-XL (siBCL-XL) siRNAs and treated with dimethyl sulfoxide (DMSO; control; D) or trametinib (40nM; T) for 72 h. The western blottings below the graphs show knockdown efficacy. (c) Graphs showing cell viability after 72 h at 200 nM (697, BV173R cells) or 40 nM (SUP-B15 cells) ABT-263 or ABT-199 with or without 40 nM trametinib as indicated. BCR-ABL1+ cells were also treated with nilotinib (1 μM). Results are relative cell viability (%) to DMSO controls. Error bars in panels (b and c): S.E.M. *P<0.05; **P<0.01. (d) Isobolograms for trametinib/ABT-263 combinations in 697, BV173R, and SUP-B15 cells. Crosses on x and y axes indicate the IC50 values for each compound. Blue dots show the concentrations of the single drugs that lead to 50% inhibition in cell viability for the given combination ratios. Combination indices (CI) for the combination drug concentrations in panel (c) are also indicated (CI<1=synergism)

