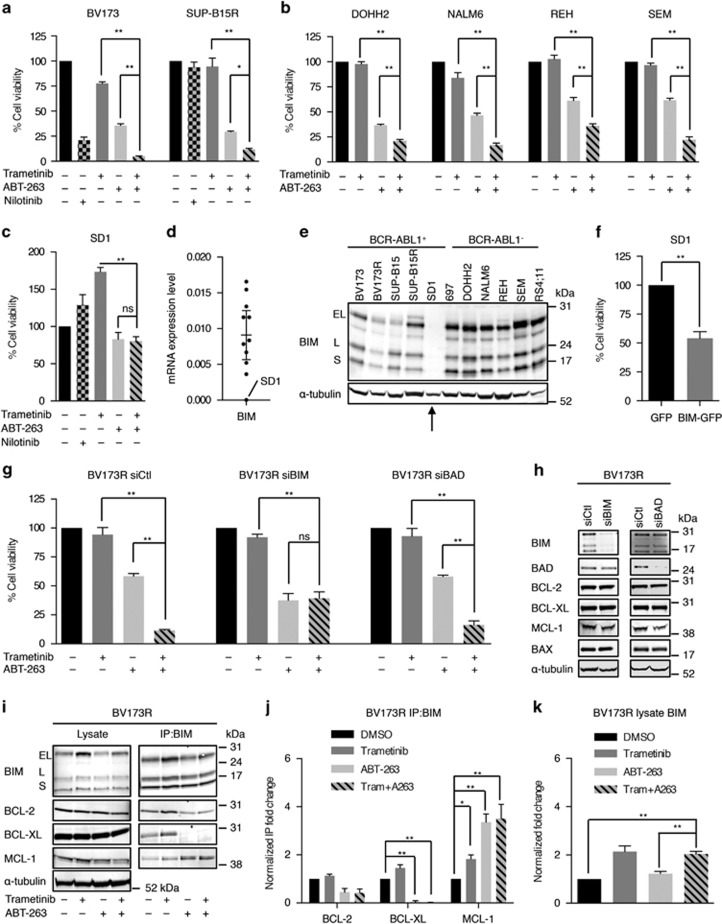
Figure 3.
BIM mediates the synergism between trametinib and ABT-263. (a) Graphs showing cell viability after 72 h at 200 nM ABT-263 with or without 40 nM trametinib in BCR-ABL1+ cells (BV173, SUP-B15R) as indicated. Nilotinib is used at 1 μM. (b) Graphs showing cell viability after 72 h at 200 nM (DOHH2, REH, SEM cells) or 1 μM (NALM6 cells) ABT-263 with or without 40 nM trametinib as indicated. (c) Graph represents viability of SD1 cells after 72 h at 1 μM ABT-263 with or without 40 nM trametinib as indicated. Nilotinib is used at 1 μM. (d) Scatter dot plot showing BIM (BCL2L11) mRNA expression relative to housekeeping gene control in the 11 B-ALL cell lines. Error bar: mean with 95% confidence intervals. (e) Western blottings show BIM and α-tubulin (loading control) expression in the B-ALL cells. (f) Graph displays (%) cell viability of SD1 cells 72 h after BIM-GFP transfection relative to GFP-transfected cells. The analysis was performed on cells selected for GFP expression by fluorescence-activated cell sorting. (g) Graphs showing BV173R cell viability 72 h after transfection with control siRNA (siCtl), siRNA BIM (siBIM), or siRNA BAD (siBAD) siRNAs and treated with trametinib (40 nM) and/or ABT-263 (200 nM). (h) Western blottings showing the level of pro-survival and antisurvival proteins in BV173R cells after transfection with siCtl, siBIM, or siBAD. (i) Western blottings showing BIM, BCL-2, BCL-XL, MCL-1, and α-tubulin (loading control) in BV173R cell lysates or BIM co-IPs 24 h after treatment with trametinib (40 nM) and/or ABT-263 (200 nM). (j) Graphs represent normalized quantification of BIM co-IPs from triplicate experiments for samples shown in panel (h). (k) Graph shows normalized quantification of total BIM in lysates from triplicate experiments for samples shown in panel (h). Results in panels (a, b, c, and g) are relative cell viability (%) to dimethyl sulfoxide (DMSO) control. Error bars in panels (a, b, c, f, g, j, and k): S.E.M. *P<0.05; **P<0.01; NS, not significant

