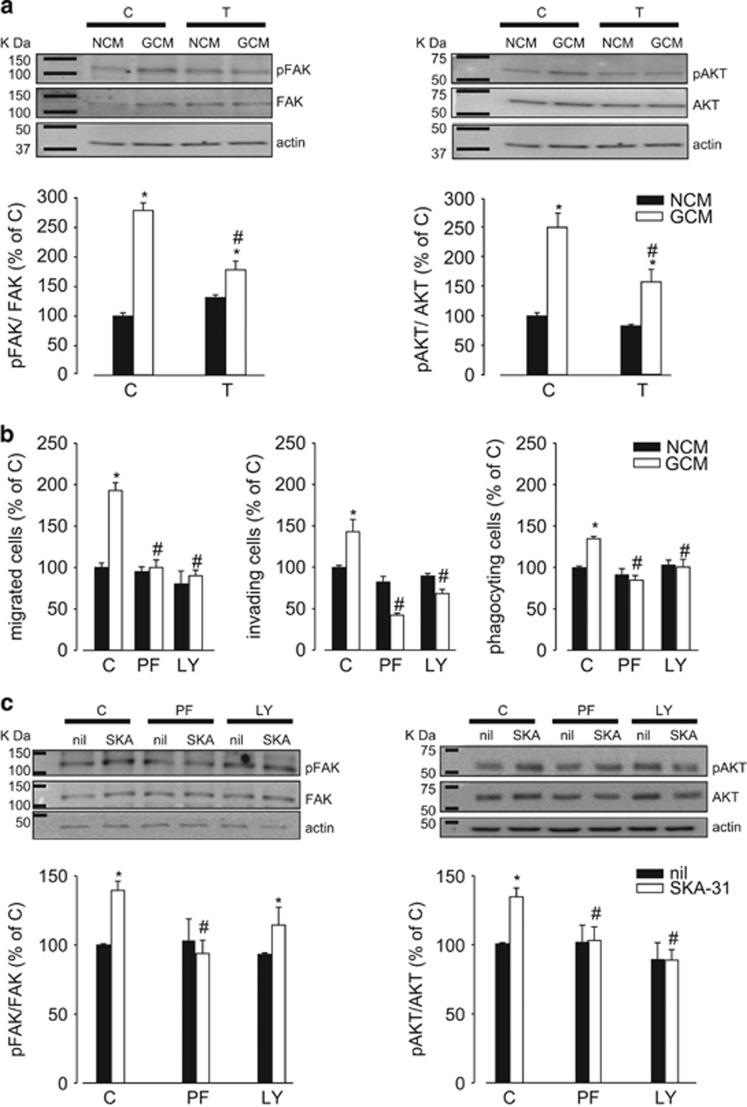
Figure 5.
Signaling pathways involved in KCa3.1 channel activation. (a) Levels of pFAK/FAK and pAKT/AKT in NCM- and GCM-treated microglia in the absence (C) or presence of TRAM-34 (T, 2.5 μM). Data are the mean±S.E.M., *P<0.05 versus NCM; #P<0.05 versus GCM/C; N=5. Representative blots are shown on the top. Actin was used as a loading control, and molecular markers are indicated on the left (KDa). (b) Migration, invasion and phagocytosis assays on NCM- and GCM-treated microglia in the absence (C) or presence of PF-228 (PF, 10 μM) or LY294002 (LY, 25 μM). Data are the mean±S.E.M., *P<0,05 versus NCM; #P<0.05 versus GCM/C; N=4. (c) Levels of pFAK/FAK and pAKT/AKT in untreated or SKA-31-treated (250 nM) microglia in the absence (C) or presence of PF-228 (PF, 10 μM) or LY294002 (LY, 25 μM). Data are shown as mean±S.E.M.; *P<0.05 versus NCM; #P<0.05 versus GCM/C; N=8. Top: representative blots are shown on the top. Actin was used as a loading control, and molecular markers are indicated on the left (KDa)

