Fig. 1.

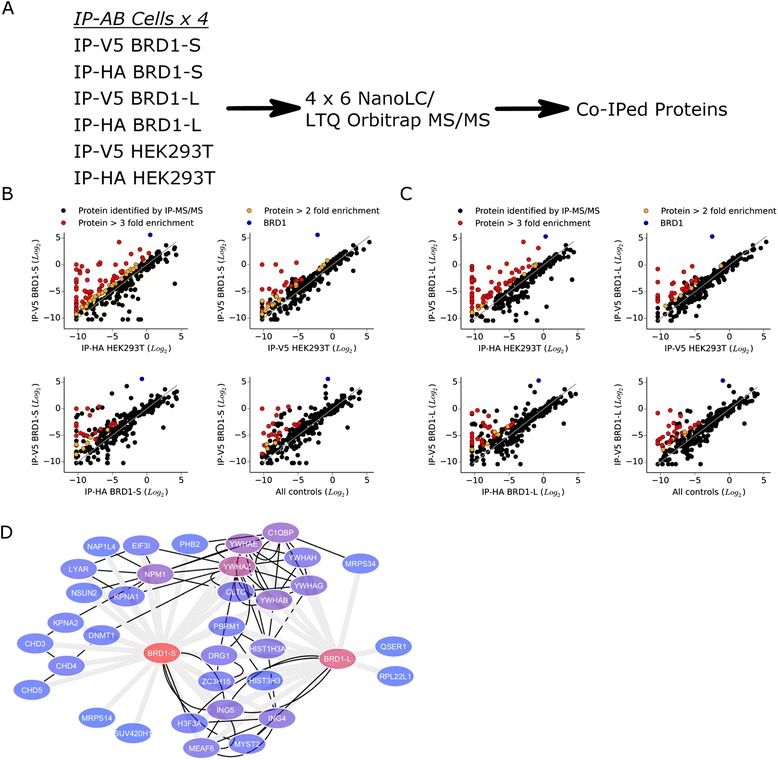
Co-immunoprecipitation (co-IP) coupled to mass spectrometry MS/MS analysis of BRD1-S and BRD1-L. a co-IPs were performed on cell extracts harvested from BRD1-S, BRD1-L, and HEK293T cell lines, using either anti-V5 antibody conjugated (IP-V5) or anti-HA antibody conjugated (IP-HA) beads. Cell culturing, extract preparation, and co-IP were repeated four times before preparation for mass spectrometry analysis (for further details, see “Methods”). b, c The combined spectral intensity of each individual protein was normalized to the mean intensity of all the proteins for each sample or control. In total, 319 proteins were identified from at least one sample or control in the analysis. The plots represent the normalized (Log2) spectral intensities of each identified protein (black) plotted as sample (y-axis) against control (x-axis). BRD1 (blue) was identified as the most enriched protein in the BRD1-S (b) and BRD1-L (c) pull-downs. The plots, from the upper right to the lower left, illustrate a stepwise sorting of proteins that showed > two- or > threefold enrichment (red and orange, respectively, and otherwise black) in the sample compared to controls. The last plots in (b) and (c) show the proteins that were identified as enriched in all controls, where the x-axis represents the mean of all the control experiments. These proteins were then further divided into three levels of co-IP strength taking into account the reproducibility of the co-IP within the repeated experiments (see Table 1). d BRD1 PPI network. Gray lines represent the interactions identified in this study by co-IP LC-MS/MS and black lines represent experimentally verified PPIs annotated in publicly available databases (BioGRID, CCSB Human Interaction Network Database, DIP, HPRD, IntAct, MINT, BIND, MPPI, and GNP). A high level of red in nodes indicates a high number of edges while a high level of blue indicates a low number of edges
