Fig. 4.

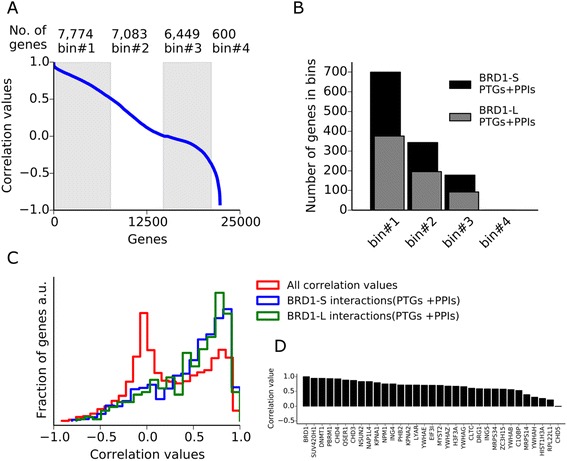
Co-expression analysis of the BRD1 interaction network in human brain. a A total of 21,906 gene-correlation values ranging from 1 to –1 were obtained across 13 developmental stages and 26 different brain regions from the Brainspan RNA-seq database. Correlation values for all genes were illustrated as a blue line and gray and white bins (#1–4) define sections (1 to 0.5, 0.5 to 0, 0 to –0.5, and –0.5 to -1) where the number of genes in each bin was shown at the top. b From the identified BRD1-S and BRD1-L PTGs + PPIs, 1241 and 672 were identified in the database, respectively. The correlation values for each gene distribute into bins #1–4 as illustrated. c The distributions of the correlation values of all genes in the Brainspan database and the correlation values of BRD1-S and BRD1-L PTGs + PPIs (BRD1-S and BRD1-L interaction networks) were summarized as relative to the number of genes and illustrated in a histogram (a.u. = arbitrary units). Mann–Whitney tests were performed for correlation values from either of the BRD1-S or BRD1-L interaction networks and all genes identified. Both tests resulted in the rejection of the null hypothesis of identical medians (P < 1 × 10⁻¹⁰). d Correlation values for the BRD1 PPIs represent the level of co-expression with BRD1 in the developing human brain
