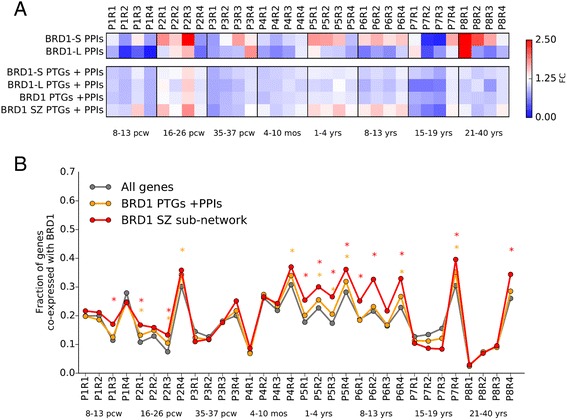
Fig. 6.

Identifying spatiotemporal networks of BRD1 in the human brain. a The fraction of co-expressed genes (correlation coefficient >0.5) was calculated for each spatiotemporal interval and each BRD1 sub-network and compared to the background of genes co-expressed with BRD1 in the entire dataset. The color-coding denotes the fold change of the fraction of co-expressed genes compared to the background. b The fraction of genes that co-expressed with BRD1 across each of the 32 spatiotemporal intervals was calculated for all genes (gray lines), genes in the BRD1 PTGs + PPI network (orange lines), and genes in BRD1 schizophrenia network of 468 genes (red lines). A one-sided binominal test was performed for each BRD1 sub-network and spatiotemporal interval compared to the expected fraction in the background where the asterisk (*) denote P < 0.05 after adjusting for the number of tests. Temporal intervals (P) were grouped as follows: P1 included pcw 8–13 (first trimester), P2 included 16–26 pcw (second trimester), P3 included 35–37 pcw (third trimester), P4 included 4–10 months, P5 included 1–4 years, P6 included 8–13 years, P7 included 15–19 years, and P8 included 21–40 years. Brain regions (R) were grouped as follows: R1 included the posterior inferior parietal cortex, primary auditory cortex, primary visual cortex, superior temporal cortex, and inferior temporal cortex; R2 included the primary somatosensory cortex, primary motor cortex, orbital prefrontal cortex, dorsolateral prefrontal cortex, medial prefrontal cortex, and ventrolateral prefrontal cortex; R3 included the striatum, hippocampus, and amygdala; and R4 included the mediodorsal nucleus of the thalamus, and cerebella cortex
