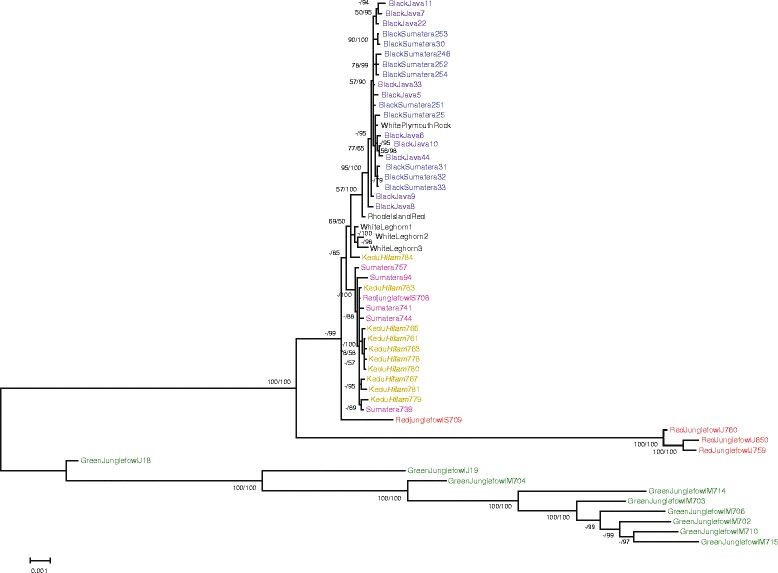
Fig. 4.

Bayesian consensus tree based on mitochondrial genome. Numbers beside internal branches indicate bootstrap values >50 % from 100 replicates (left) and Bayesian posterior probabilities (right). (-) indicates a node not recovered in the maximum-likelihood analysis or bootstrap values <50 %. Abbreviations are defined in Fig. 2. Numbers after the name breed are the sample numbers. Colors on labels are defined in Fig. 3
