Fig. 1.

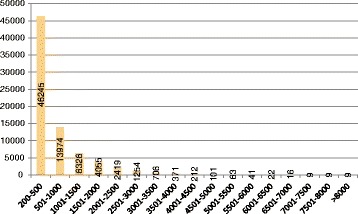
Length distribution of the pepino (S. muricatum) transcriptome most expressed transcripts. Horizontal axis represents the size range of each unigene. Vertical axis represents the number of unigenes for every interval

Length distribution of the pepino (S. muricatum) transcriptome most expressed transcripts. Horizontal axis represents the size range of each unigene. Vertical axis represents the number of unigenes for every interval