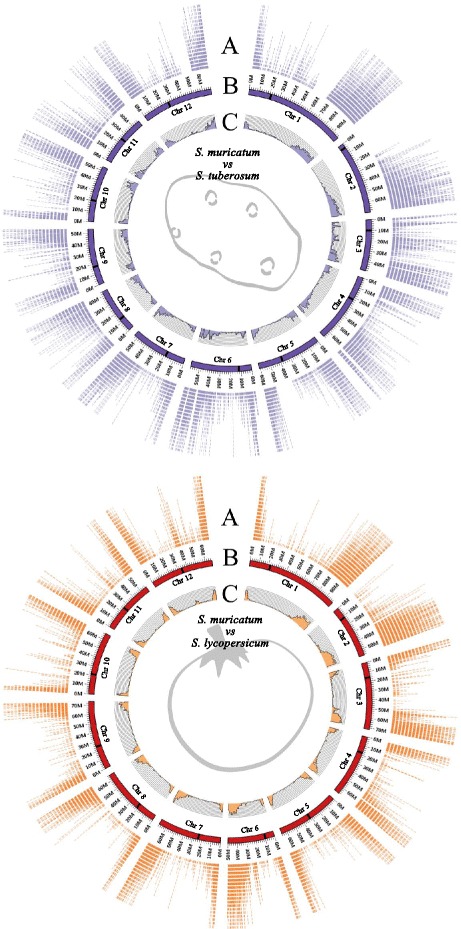
Fig. 5.

Graphical representation of the pepino unigenes positions on the chromosomes of potato (top) and tomato (bottom) and nucleotide-level variants distribution/density found on these chromosomes. a Distribution of the pepino unigenes on chromosomes, (b) ideograms of the 12 chromosomes, black bar indicates the approximated position of the centromere, (c) variants distribution/density, every column indicates the number of variants per Mb
