Fig. 1.

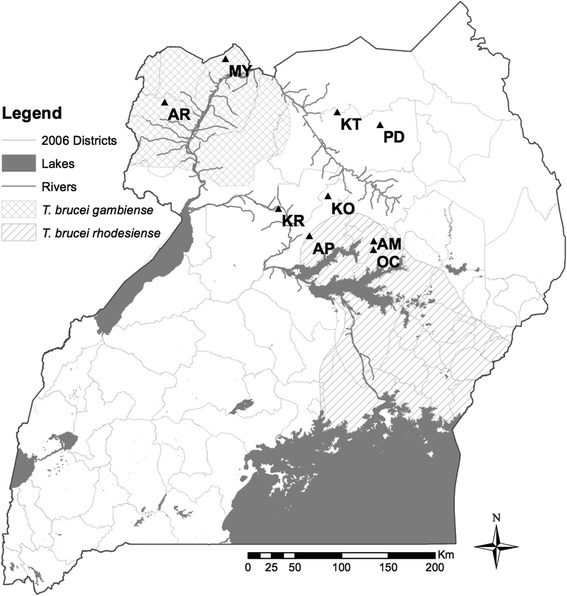
Map of Uganda showing sampling sites. The temporal sites are shown with population codes, as well as the two HAT disease belts in Uganda (T. b. gambiense and Tbr is T. b. rhodesiense)

Map of Uganda showing sampling sites. The temporal sites are shown with population codes, as well as the two HAT disease belts in Uganda (T. b. gambiense and Tbr is T. b. rhodesiense)