Fig. 2.

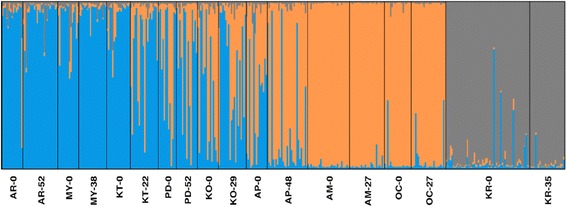
Structure plots of temporal samples. Plots show clustering of samples, organized north to south, with the first time-point sampled followed by the second time-point sampled

Structure plots of temporal samples. Plots show clustering of samples, organized north to south, with the first time-point sampled followed by the second time-point sampled