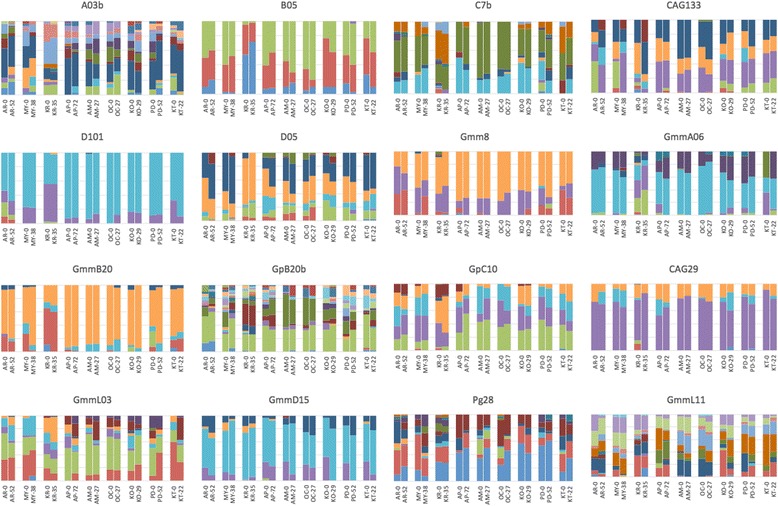
Fig. 3.

Microsatellite allele frequencies from two time points in nine populations of G. f. fuscipes in northern Uganda. Numbers after location code indicate the time interval (in generations) since the first sampling. Vertical bars represent allele frequencies, and each color represents a single allele. The heading of each chart lists the microsatellite locus (A03b, B05, C7b, D101, D05, GmmL03, GmmD15, Gmm8, GpB20b, GmmA06, GmmB20, GmmL11, GpC10, CAG29, Pg28, CAG133)
