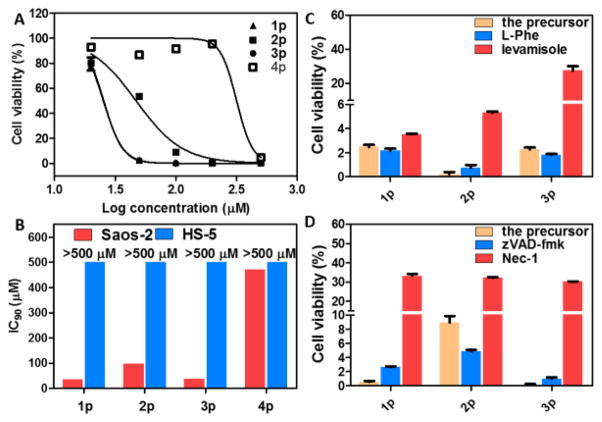
Fig. 4.
A) Cell viability (log-dose response curves) for sarcoma osteogenic (Saos-2) cells treated with 1p, 2p, 3p or 4p. B) IC90 values (48 h) of 1p, 2p, 3p, and 4p against Saos-2 and HS-5 cells. C) The cell viability of Saos-2 cells treated with 1p (50 μM), 2p (200 μM), or 3p (50 μM) in the presences of different ALP inhibitors (L-Phe and levamisole). Cells were treated for 48h; [L-Phe] = 1 mM; [levamisole] = 1 mM. D) The cell viability of Saos-2 cells treated with 1p, 2p, or 3p (100 μM) in the presence of a pan-caspase inhibitor (zVAD-fmk) or a necroptosis inhibitor (Nec-1). Cells were treated for 48h; [zVAD-fmk] = 45 μM; [Nec-1] = 50 μM. All cell viability test are done in triplicate (n = 3).

