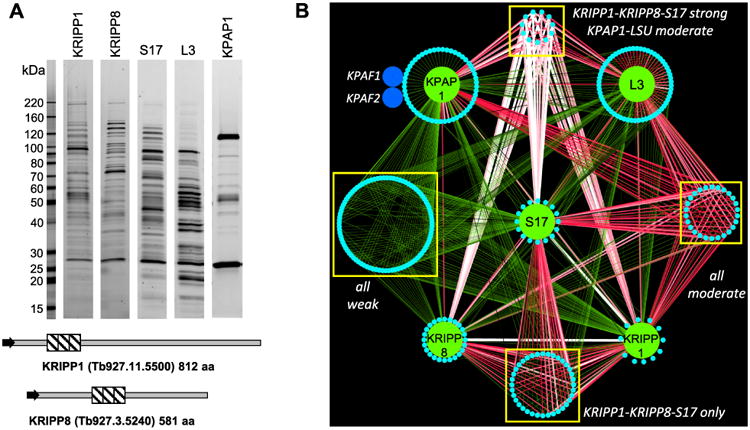
Fig. 1.

Interaction network of mitochondrial ribosomal, KRIPP-associated and polyadenylation complexes.
A. Tandem affinity purifications were carried out in parallel under uniform conditions (100 mM of KCl and 10 mM of MgCl2). Final fractions were separated in 8–16% SDS gel and stained with Sypro Ruby.
B. Visual representation of LC-MS/MS analyses of affinity purified complexes. Interaction network was generated in Cytoscape software from bait-prey pairs in which the prey protein was identified with at least 4 unique peptides (Supporting Information Table S1). The edge thickness and color intensity correlate with dNSAF values for bait-prey interactions; reciprocal contacts (i.e. bait-bait interactions captured in both purifications) are depicted by a single edge as the sum of two dNSAF values. Proteins shared by all five complexes are clustered as ‘weak’ and ‘moderate’ based on dNSAF values of each bait-prey pair; polypeptides overrepresented in KRIPP1, KRIPP8 and S17 are grouped as ‘KRIPP1-KRIPP8-S17 strong’. Proteins unique to each bait are positioned on a periphery of each named node.
This figure is available in colour online at wileyonlinelibrary.com.
