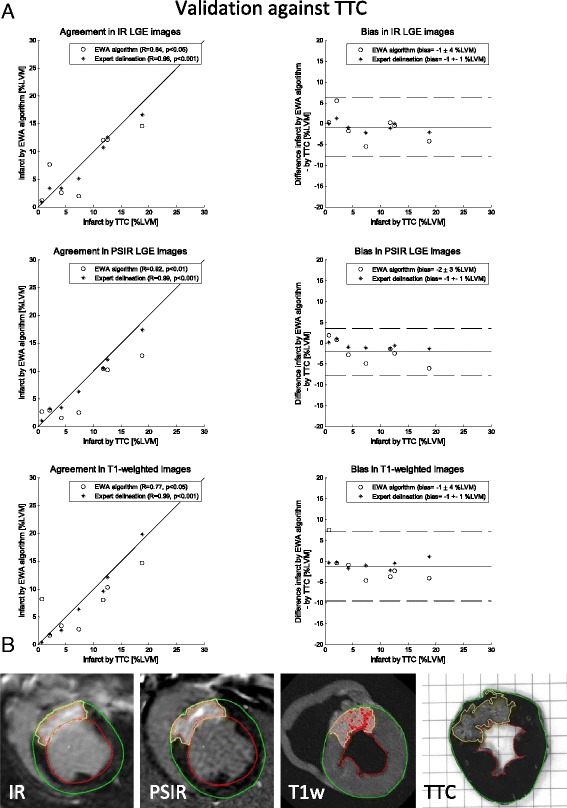
Fig. 3.

Validation against TTC: a Scatter plots (left column) and Bland-Altman plots (right column) of infarct size expressed as % of left ventricular mass (%LVM) for the EWA algorithm against infarct size by triphenyltetrazolium-chloride (TTC) in pigs with myocardial infarction imaged after seven days (n = 7) with in-vivo magnitude inversion recovery LGE images (IR, top row), in-vivo phase sensitive inversion recovery LGE images (PSIR, middle row) and ex-vivo high resolution T1-weighted images (T1w, bottom row). Left column: solid line = line of identity; dashed line = regression line. Right column: solid line = mean bias; dashed line = mean ± two standard deviations. b Infarct segmentation by the EWA algorithm in one pig shown in one slice of in-vivo IR LGE, in-vivo PSIR LGE, ex-vivo high resolution T1w and corresponding TTC-stained slice. Infarct segmentation by the EWA algorithm and by manual delineation in TTC images is shown in yellow. For the automatic EWA segmentation the core of the infarct is shown in pink and microvascular obstruction is shown as the red line within the infarct. Endocardium is delineated in red and epicardium in green
