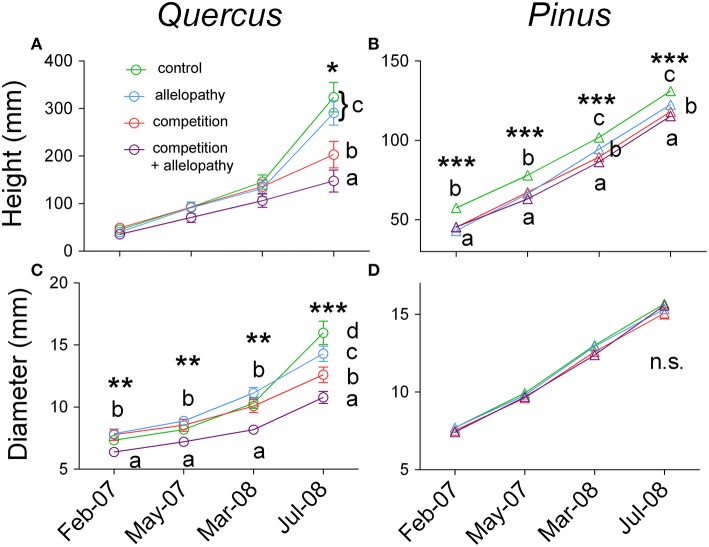
Figure 2.
Temporal effects of interference treatment on growth of both species. Height (A,B) and diameter growth (C,D) response in Quercus (A–C) and Pinus (B–D) across four dates of measurements (February and May 2007, March and July 2008) in Control (green lines and symbols), Allelopathy (blue lines and symbols), Competition (red lines and symbols), and Allelopathy + Competition (purple lines and symbols). Symbols represent means ± SD of 20 replicates. Different letters indicate a significant difference between treatments at P < 0.05 (*), P < 0.01 (**), and P < 0.001 (***).

